Uniswap (UNI/USD) Rebounding, Hits $30 Resistance
Estimated Reading Time: 3 minutes
Don’t invest unless you’re prepared to lose all the money you invest. This is a high-risk investment and you are unlikely to be protected if something goes wrong. Take 2 minutes to learn more
Uniswap Price Prediction – June 3
After a stem of variant rebounding movements that the UNI/USD market operations have been witnessing over a couple of days, the crypto now has to meet a resistance around the value of 30 as price currently trades around $28.20 at a 2.08% increases.
UNI/USD Market
Key Levels:
Resistance levels: $35, $40, $45
Support levels: $20, $15, $10
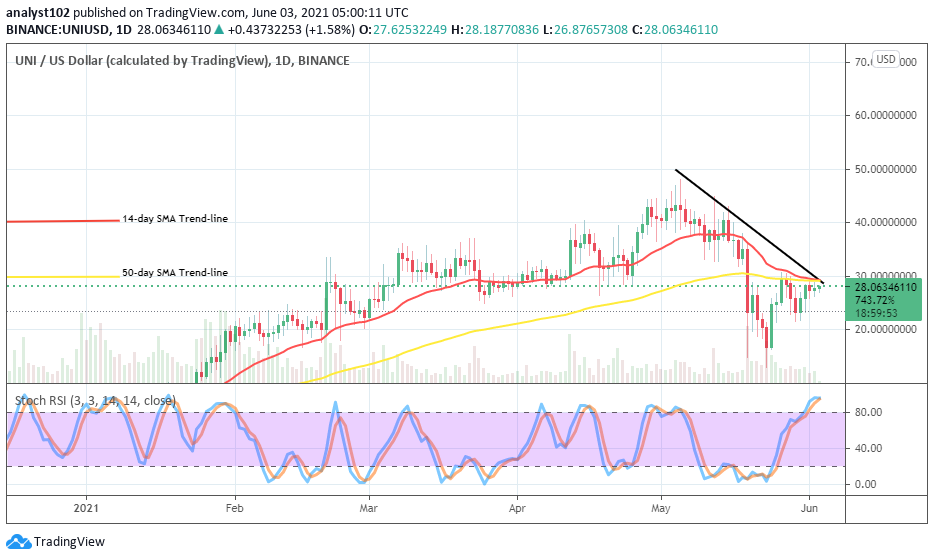
UNI/USD – Daily Chart
On the UNI/USD daily chart, it is been displayed that the crypto has sprung northward to an area of bearish-path point is made. Hence, the reason the bearish trend-line drew above the SMAs to locate those important points. From May 27 until the present session, the price has been hovering close below the key resistance point of $30. The 14-day SMA trend-line has moved down from the top to touch the 50-day SMA indicator around the value earlier mentioned. The Stochastic Oscillators are in the overbought region with the blue line attempting to close with the red line to possibly suggest that an upward strength is fading off gradually.
Does the UNI/USD need a slight pull-down below the $30 level to surge in an upward move continuation?
It appears at that point of trading position as the Stochastic Oscillators have signaled the near possibility of getting to see a gradual fade-off in the UNI/USD bulls’ smooth run around the level of $30, a pull-down is much expected to occur in no time to allow a rebuilding upward movement in the market. The support levels between $25 and $20 are expected to witness the presumed sentiment to play out afterward.
As at this valuable point in the UNI/USD market activities, the current $30 resistance line potentially gives a sell trading opportunity to bears to launch an entry. A successful interception of the bigger SMA indicator from the top by the smaller SMA trend-line will portend a strong confirmation of a downward move’s return once again in the crypto economy.
UNI/BTC Price Analysis
Ups and downs, the UNI/BTC price analysis chart still depict that the duo-crypto market is in a bullish trend outlook. From May 24th day’s session, the base crypto managed to embark upon a recovery move as paired with the flagship counter trading crypto. The 14-day SMA trend-line is situated above the 50-day SMA indicator as they both point toward the north. Price is now seen trading on the buy signal side of the smaller SMA close below the key resistance that the base instrument once witnessed in the past. The Stochastic Oscillators are in the overbought region with an open space between the two lines slightly pointing toward the northbound. However, the base crypto may in the near time lose momentum once again to the counter crypto especially while it fails to breach past the resistance drew at B0.00080 at a later volatile trade operation.
Note: new.cryptosignals.org is not a financial advisor. Do your research before investing your funds in any financial asset or presented product or event. We are not responsible for your investing results.