Uniswap (UNI/USD) Trade Is Turning Up Above $5, Following a Dump
Estimated Reading Time: 3 minutes
Don’t invest unless you’re prepared to lose all the money you invest. This is a high-risk investment and you are unlikely to be protected if something goes wrong. Take 2 minutes to learn more
Uniswap Price Prediction – July 13
In the transaction involving Uniswap and the US coin, a convergence of prices occurred around the resistance of $5.50, which now portends that the crypto-economic trade is turning up above $5 following a dump.
It has shown that the market’s gravity has been slowly recovering from a lower-bullish moving path that is putting its support close to the $5 mark. There might be a consistent level of showcasing variant ups and downs between that value line and the resistance line of $5.50 as the market keeps a 1.49 percentage rate of positives to bargain between $5.3881960 and $5.2228804. It is necessary to let there be some levels of down pulls before leveraging on a return of movement to the north side.
UNI/USD Market
Key Levels:
Resistance levels:$5.50, $6, $6.50
Support levels: $4.50, $4, $3.50
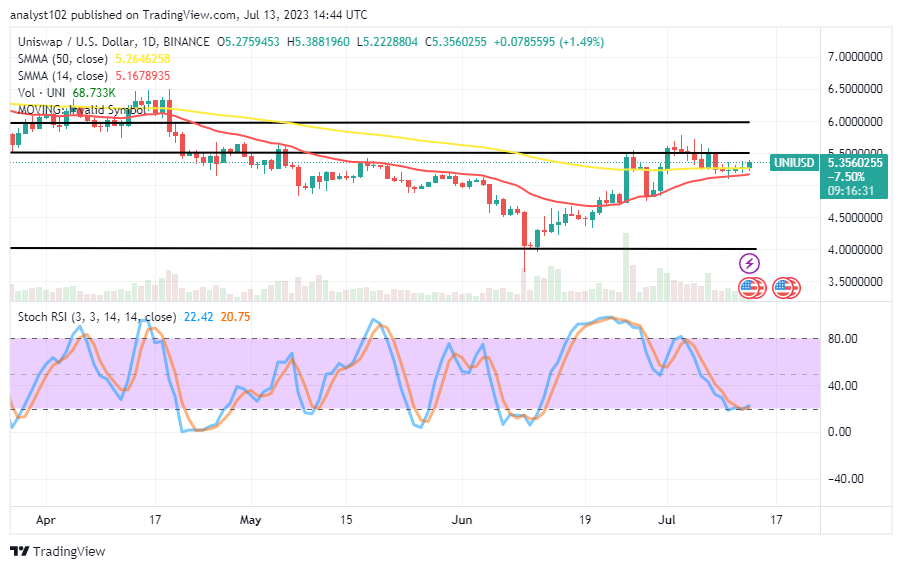
UNI/USD – Daily Chart
The UNI/USD daily chart reveals the crypto trade is turning up from the $5 level, following a dump that is merely far from the last session of convergences.
An in-depth technical look at the representing candlesticks has revealed that most indicators suggest that price has been in the mood to find support around or near the trend line of the 14-day SMA, which is underneath the 50-day SMA indicator. The Stochastic Oscillators have traversed southbound to lay around the territory of 20 and are now in positions from 20.75 to 22.42. That explains that a lighter run to the up is in the card.
Should traders expect a sharp break to the downside against the UNI/USD market’s 14-day SMA soon?
Some indications have been in support of seeing the price regaining a spring through a path placing it northward below the candlesticks as the UNI/USD trade has been turning up above the $5 level following a dump.
A resettlement format seems to have been embarked upon by the UNI/USD market bulls. And that presumption has been confirmed by the current positioning posture of the Stochastic oscillators, with a couple of smaller bullish candlesticks.
Analizing a presumable conducive trading session for the UNI/USD market bears, it would be a good idea to also adhere to the repositioning outlook of the Oscillators afterward in an overbought environment before going for a shorting order.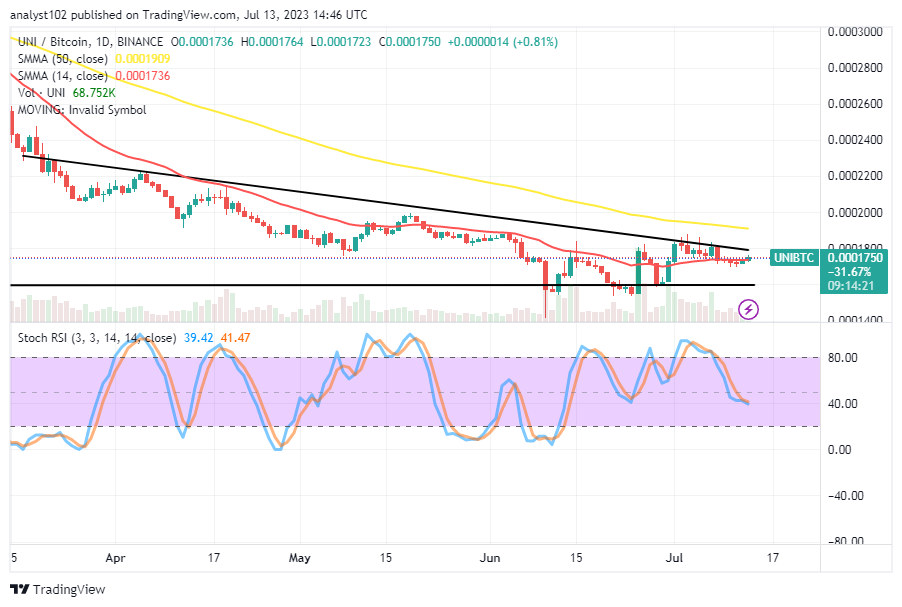
UNI/BTC Price Analysis
In contrast, the Uniswap’s market valuation has been attempting to turn up from underneath the SMA trend lines against Bitcoin, following a dump that has occurred on a lowly-moving style.
The 14-day SMA indicator is below the bearish trend line, while the 50-day SMA indicator is on its top side. They still portend a falling index against the base cryptocurrency. The Stochastic Oscillators are positioned from 41.47 to 39.42 levels after dwelling in the overbought region. A shift to the downside might be forthcoming in a less-active pushing mode before allowing a rebound afterward.
Note: Cryptosignals.org is not a financial advisor. Do your research before investing your funds in any financial asset or presented product or event. We are not responsible for your investing results.
You can purchase Lucky Block here. Buy LBLOCK