Wall Street Memes (WSM) Market Affirms a Base, Raising Hikes
Estimated Reading Time: 3 minutes
Don’t invest unless you’re prepared to lose all the money you invest. This is a high-risk investment and you are unlikely to be protected if something goes wrong. Take 2 minutes to learn more
Wall Street Memes Price Prediction – April 11
Price movements that have been featured in the business operations of Wall Street Memes coin as paired with the valuation of the US currency currently show that the crypto market affirms building on a base, raising hikes in most attempted moves.
The price behavior of the pair has reflected selling pressure conducive to long-term investors re-entering positions near the lower bands of the Bollinger indicator. It is advised that market participants rely on oscillator signal structures to time long entries with greater precision.
WSM/USD Market
Key Levels
Resistance levels: $0.0015, $0.002, $0.0025
Support levels: $0.0008, $0.0006, $0.0004
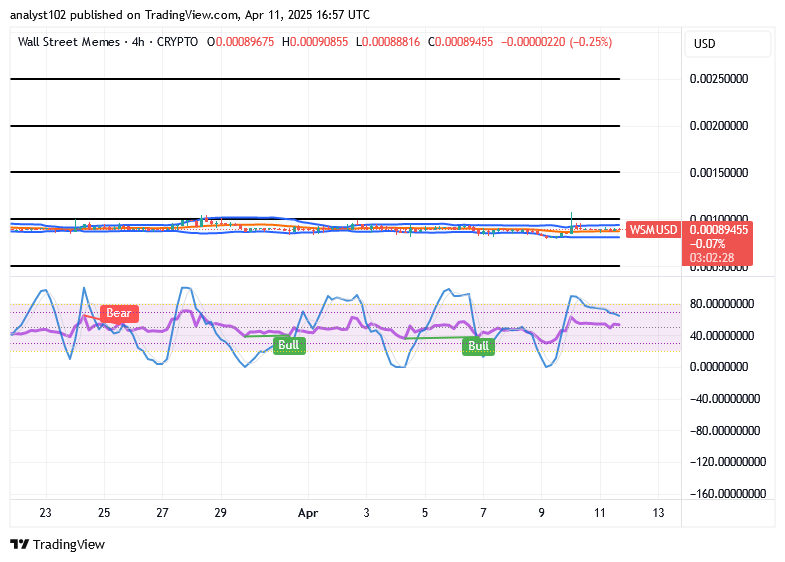
WSM/USD – 4-hour Chart
The WSM/USD medium-term display shows that the crypto-economic market affirms a base, raising hikes in its inputs.
Trend extensions along the Bollinger Bands have formed within varying range amplitudes, with the $0.001 level acting as a critical resistance threshold obstructing a dependable recovery trajectory toward value appreciation. At the time of this analysis, the stochastic oscillators have exhibited a systematic northbound pivot, indicating momentum impulses that suggest a potential continuation of upward price action.
Given sustained range activity below $0.001, is there potential for a sustainable bullish breakout in WSM/USD?
The continuation of the transactions’ proceedings in the WSM/USD market that have not refused staging in sideways are tenable to allow persistent accumulation of catalysts, as the financial situation affirms on a base formation, raising hikes’ signal notes in the deals.
Executing long position orders may face weak rebound momentum, offering only modest support for short-term upward moves. Since these developments appear to be temporary, bearish traders should be cautious about attempting a comeback in the current range-bound market conditions.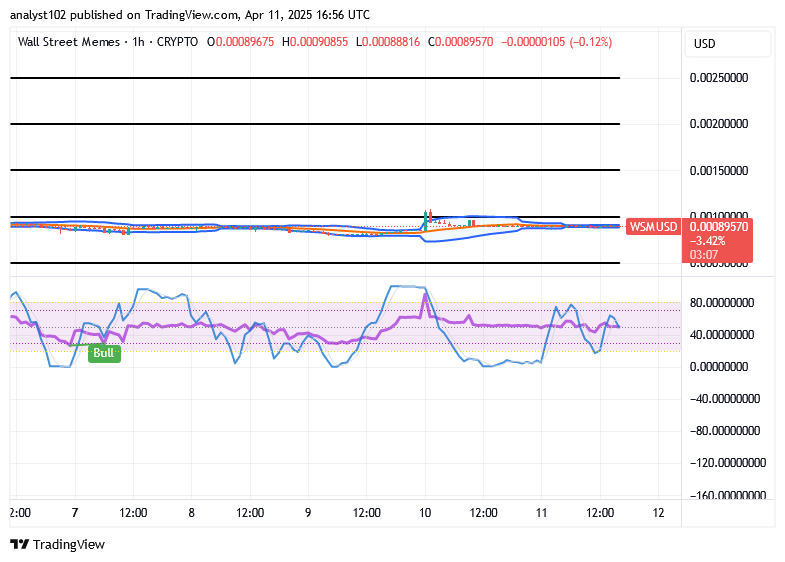
WSM/USD 1-hour chart
The WSM/USD 1-hour chart exhibits that the short-term trading pathway of the crypto-economic price affirms a base rebuilding process, raising hikes in inputs.
The stochastic oscillators have exhibited cyclical fluctuations across multiple levels while maintaining a bullish bias throughout recent phases. Concurrently, the Bollinger Bands are presenting a flattened configuration, indicating a predominantly sideways market structure.
$WSM community, we saw your passionate Tweets and ongoing support!
$WSM community, we saw your Tweets! 👏$WSM / $USDT is now tradeable on #Bybit Perpetuals.
— Bybit (@Bybit_Official) October 13, 2023
Trade here: https://t.co/le4XyVyXaZ
Also want your project listed? Share your suggestions here:https://t.co/W7EWJVVNV5 https://t.co/XgXoL7g0rF