Wall Street Memes (WSM) Market Poses, Upbringing Spirals
Estimated Reading Time: 3 minutes
Don’t invest unless you’re prepared to lose all the money you invest. This is a high-risk investment and you are unlikely to be protected if something goes wrong. Take 2 minutes to learn more

Wall Street Memes Price Prediction – August 4
Today’s bargaining sessions, as of the time of this write-up, reflect a continued pattern in which WSM market bulls are advancing at a moderated pace against the purchasing strength of the U.S. dollar, as the base instrument’s movement poses emerging spirals in its outlook.
It is becoming increasingly critical for long-term position movers to reassess the notion of continued position staking, as the WSM/USD market now consolidates around the \$0.0006 mark—introducing heightened technical strain that may warrant strategic exits over clinging to speculative conviction.
WSM/USD Market
Key Levels
Resistance levels: $0.0008, $0.0009, $0.001
Support levels: $0.0005, $0.0004, $0.0003
WSM/USD – 4-hour Chart
The medium-term chart of the WSM/USD price poses around a smaller-reduced trade-line of $0.0006, bringing up spirals in the stances.
The Bollinger Bands indicators have gone downward to get re-positional outlooks around $0.0006 that are potentially going to portray decent long entries. The stochastic oscillators are systematically stretching their pathways eastward, primarily around lower zones, with 40 appearing as the upper limit, signaling a sustained weakening in downside momentum.
Should Sellers Reconsider Dumping WSM/USD at $0.0006 and Instead Exercise Caution Amid Rebound Prospects?
Long-term position pushers should maintain composure, as the $0.0006 pullback may precede a strategic rebound, making premature sell-offs potentially disadvantageous in the broader accumulation outlook, as the WSM/USD price poses upward-spiraling tendencies in its output.
Medium- and short-term traders in the WSM/USD market are advised to approach the prevailing downward trajectory with heightened caution, as price behavior within this zone retains a high propensity for abrupt whipsaw reversals that may aggressively undermine bearish alignments—suggesting latent bullish re-accumulation dynamics beneath the surface. Such volatility reflects a market in transition, where liquidity traps and algorithmic re-calibrations may trigger false breakdowns.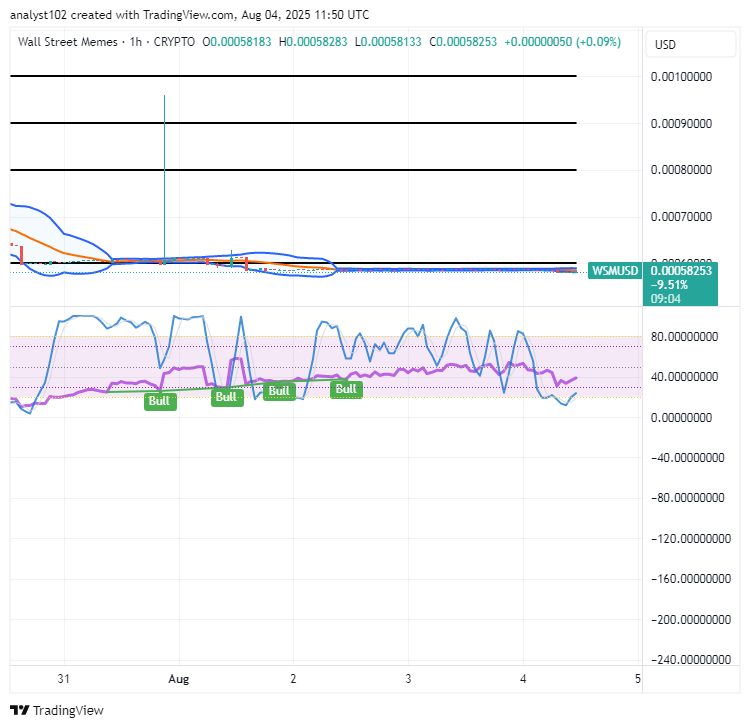
WSM/USD 1-hour chart
The 1-hour chart of the WSM/USD market reveals that the former instrument poses in its movement styles, upbringing spirals in the indexes setups.
The stochastic oscillators have moved southbound into the oversold region to denote that selling force tends to start losing relevance in no time. The Bollinger Bands remain aligning eastward, confirming that the market is currently in a sideways consolidation phase, one that typically lacks prolonged stability.
BIGTIMEUSDT & WSMUSDT Contracts now on Bybit!
Dive into new trading opportunities with 1–25x leverage. Plus, they’re now available on Bybit Futures Grid Bot with enhanced precision and execution speed. Start trading now!
🚀 BIGTIMEUSDT & WSMUSDT Contracts now on Bybit!
— Bybit (@Bybit_Official) October 12, 2023
Dive into new trading opportunities with 1-25x leverage. Plus, they’re now on Bybit Futures Grid Bot! Start trading now.
📈 BIGTIME: https://t.co/FAQlbhnzAh
📈 WSM: https://t.co/pb2y2AfMBE#CryptoTrading #Bybit