Wall Street Memes (WSM) Price Is Down, Uptick Bias Starts
Estimated Reading Time: 3 minutes
Don’t invest unless you’re prepared to lose all the money you invest. This is a high-risk investment and you are unlikely to be protected if something goes wrong. Take 2 minutes to learn more
Wall Street Memes Price Prediction – November 15
Wall Street Memes (WSM) price action remains under short-term downside pressure, but recent candles show narrowing spreads and stabilizing lows. Momentum indicators highlight weakening sell strength, suggesting accumulation may be forming as an early uptick bias begins to surface.
Wall Street Memes price continues to trade under short-term downside pressure, yet the market structure shows early signs of stabilization as sellers lose momentum. Gradually tightening ranges, improving volume behavior, and a soft rebound in key indicators suggest an emerging uptick bias that could mature with time. While near-term volatility may persist, the broader setup continues to favor patient, long-term positioning, as accumulation phases typically precede sustained upside cycles.
WSM/USD Market
Key Levels
Resistance levels: $0.0004, $0.00045, $0.0005
Support levels: $0.0003, $0.00025, $0.0002
WSM/USD – 4-hour Chart
Analysis of the WSM/USD medium-term chart indicates that the crypto market is experiencing a downward phase, while early signs of an uptick bias are beginning to emerge.
The Bollinger Bands show a mild downward trajectory, dipping briefly before leveling off, suggesting a potential reversal. Meanwhile, the Stochastic Oscillators remain in oversold territory, moving steadily and indicating that renewed buying pressure could drive a gradual shift back toward the upside.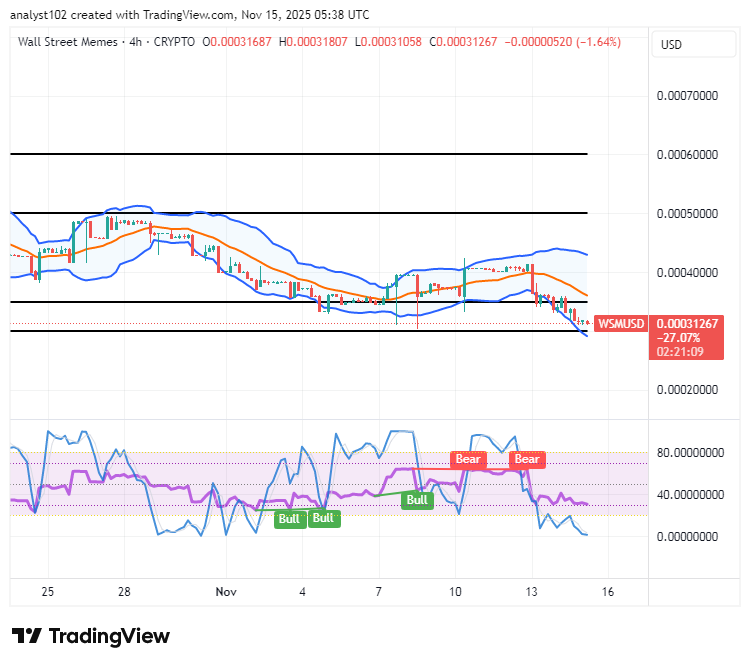
Could Wall Street Memes (WSM) Maintain Its Emerging Uptick Bias as Price Weakness Gradually Fades?
Wall Street Memes market could maintain its emerging uptick bias if current stabilization persists and buyers continue absorbing dips. Strengthening momentum signals and narrowing volatility ranges further support the possibility of a gradual shift toward sustained recovery in the coming sessions.
Wall Street Memes (WSM) appears poised to maintain its emerging uptick bias if the current stabilization holds and buying interest continues to absorb intermittent dips. Technical indicators suggest weakening sell pressure, while narrowing volatility ranges hint at potential accumulation. Patience may reward long-term holders, as these early signals often precede more sustained upward trends over time.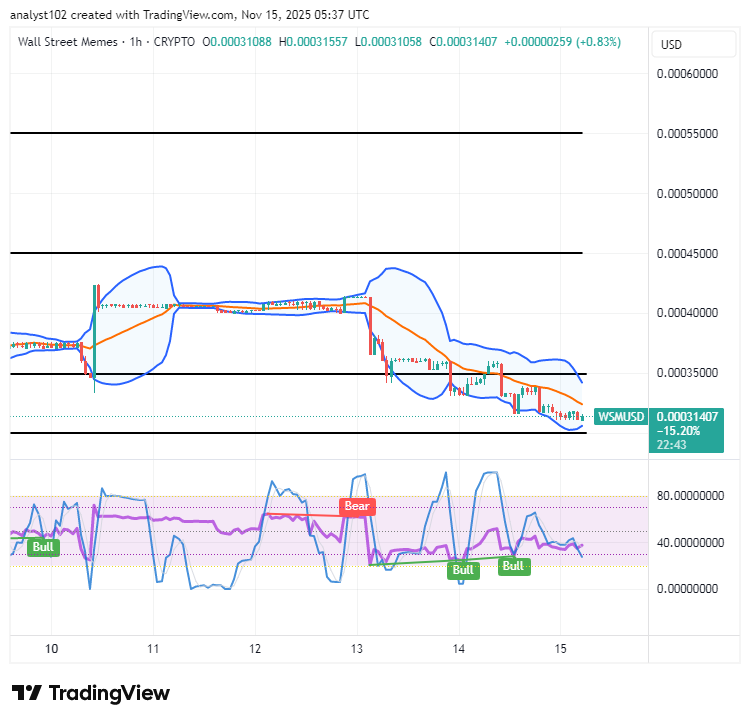
WSM/USD 1-hour chart
The WSM/USD short-term chart reveals the base crypto-economic market is down, and an uptick bias starts.
The Bollinger Bands are trending downward, gradually extending to form a structure resembling a bullish flag. In parallel, the Stochastic Oscillators have moved deep into oversold levels, signaling that underlying momentum is building and setting the stage for a potential upward reversal.
$WSM/$USDT is now available for trading on Bybit Perpetuals.
Start trading here:
Want to see your favorite project listed? Share your suggestions here: [http://i.bybit.com/1Fd2aboX](http://i.bybit.com/1Fd2aboX)
$WSM community, we saw your Tweets! 👏$WSM / $USDT is now tradeable on #Bybit Perpetuals.
— Bybit (@Bybit_Official) October 13, 2023
Trade here: https://t.co/le4XyVyXaZ
Also want your project listed? Share your suggestions here:https://t.co/W7EWJVVNV5 https://t.co/XgXoL7g0rF