Wall Street Memes (WSM) Price Reactivates, Gaining Momentum
Estimated Reading Time: 3 minutes
Don’t invest unless you’re prepared to lose all the money you invest. This is a high-risk investment and you are unlikely to be protected if something goes wrong. Take 2 minutes to learn more
Wall Street Memes Price Prediction – April 19
As there have been variant slower movements marking the impacts of both bulls and bears in the operations of Wall Street Memes coin versus the economic valuation of the US currency, it remains highly possible to see the pairing instruments breaking through potential resistances in the near term, given that the crypto-economic price is reactivating on a baseline and gaining momentum in its indexes.
Each day presents varying signals that suggest promising entry points for long-term investors. Considering additional factors, the use of the lower Bollinger Band will play a crucial role in identifying suitable conditions for executing buy orders, especially while the market has yet to stage a significant breakout above the key resistance level of $0.001.
WSM/USD Market
Key Levels
Resistance levels: $0.0015, $0.002, $0.0025
Support levels: $0.0008, $0.0006, $0.0004
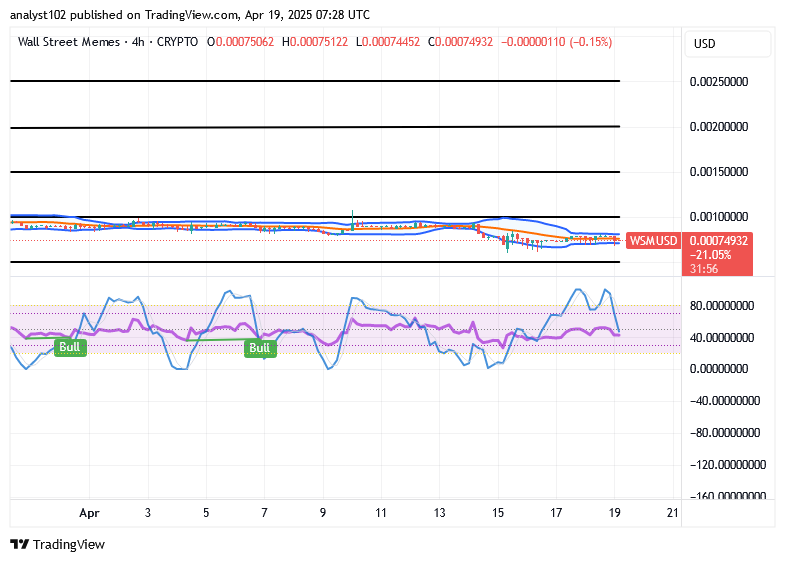
WSM/USD – 4-hour Chart
The WSM/USD medium-term chart setting showcases that the crypto-economic price reactivates, gaining momentum.
The Bollinger Bands are currently attempting to form tighter trade zones around the $0.0075 level. The stochastic oscillators are gradually repositioning, suggesting a reduced likelihood of further sustained downside movement in the near term.
With price action reactivating near the lower Bollinger Band, is bullish positioning in the WSM/USD market at risk of structural erosion?
Given that the WSM/USD market is rebuilding its bottoms around the lower Bollinger Band, it is likely that buyers will hold on firmly as the crypto-economic price reactivates its base, gaining momentum.
A conclusive pattern appears to be forming, characterized by successive lower lows and lower highs across the declining trading zones in which the pairing market currently operates. If this structural sentiment holds, buyers should remain focused on recovery-driven strategies to capitalize on potential reversal setups. 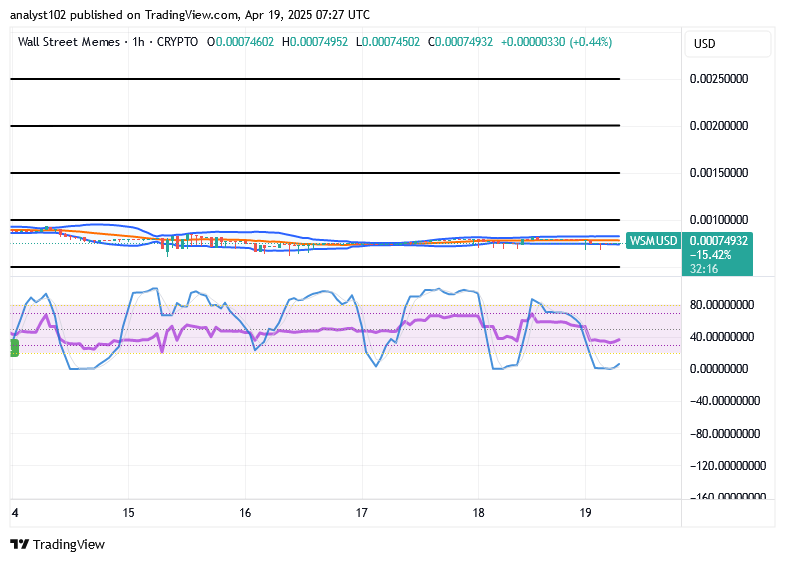
WSM/USD 1-hour chart
The hourly compositions of the WSM/USD market signify that the crypto-economic trade reactivates its basis, gaining momentum.
The Bollinger Bands have steadily continued stretching eastward, maintaining a horizontal range between $0.001 and $0.0005. Meanwhile, the stochastic oscillators have settled within the oversold territory, signaling a diminishing likelihood of sustained bearish momentum as downside pressure shows signs of exhaustion.
Explore enhanced trading opportunities with up to 25x leverage on these newly listed perpetual contracts.
Now available on the Bybit Futures Grid Bot, these instruments support automated strategy execution, increased liquidity access, and real-time risk management. Start executing your trading algorithms today.
🚀 BIGTIMEUSDT & WSMUSDT Contracts now on Bybit!
— Bybit (@Bybit_Official) October 12, 2023
Dive into new trading opportunities with 1-25x leverage. Plus, they’re now on Bybit Futures Grid Bot! Start trading now.
📈 BIGTIME: https://t.co/FAQlbhnzAh
📈 WSM: https://t.co/pb2y2AfMBE#CryptoTrading #Bybit