Wall Street Memes (WSM) Price Stalls, Buyers Stay in Control
Estimated Reading Time: 3 minutes
Don’t invest unless you’re prepared to lose all the money you invest. This is a high-risk investment and you are unlikely to be protected if something goes wrong. Take 2 minutes to learn more

Wall Street Memes Price Prediction – October 18
Wall Street Memes (WSM) price movement reflects a slowdown in bullish momentum, yet buyers remain dominant in market operations. Bears have shown limited strength, while bulls continue defending support zones to maintain short-term control and prevent deeper retracement levels.
The WSM/USD market’s price movement has slowed slightly, signaling a brief consolidation phase within a broader bullish structure. Despite minor resistance from bears, buyers maintain strategic control, suggesting potential for renewed upward traction. If momentum strengthens above nearby support zones, bulls may reclaim dominance, paving the way for a promising recovery toward higher resistance territories in the near term.
WSM/USD Market
Key Levels
Resistance levels: $0.0008, $0.0009, $0.001
Support levels: $0.0005, $0.0004, $0.0003
WSM/USD – 4-hour Chart
The WSM/USD medium-term chart shows that the crypto-economic business slows down, as buyers stay in control.
The Stochastic Oscillators are southbound, having traversed into the oversold region, affirming the potentiality of seeing bulls strongly recouping at a lower-end spot in the near term. The Bollinger Bands presently range between roughly $0.0006 and $0.0005, with candlesticks clustering toward the mid-to-lower axis, indicating compressed volatility and a potential buildup for a bullish rebound soon.
Can WSM/USD Trade Sustain Buyer Dominance and Regain Upward Momentum Toward Higher Resistance Zones?
Wall Street Memes (WSM) continues to exhibit resilient buyer activity despite minor slowdowns. Sustaining momentum above support levels could reinforce bullish confidence, positioning the asset for another potential rally toward key resistance areas soon.
Wall Street Memes (WSM) maintains a resilient bullish structure despite short-term pullbacks, with buyers sustaining control above critical support zones. Technical indicators favor gradual accumulation, suggesting that long-term position holders may benefit significantly as market momentum strengthens. A sustained break above resistance could confirm renewed upside potential, leading to extended profit opportunities over time.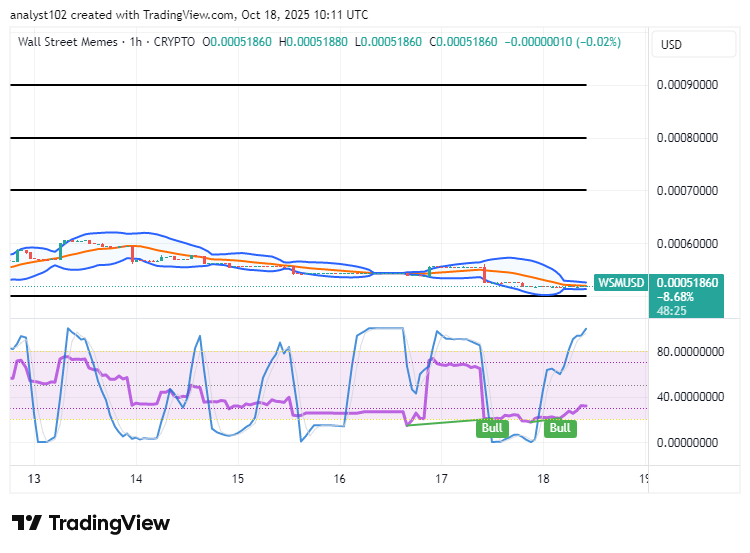
WSM/USD 1-hour chart
It is revealed on the WSM/USD 1-hour chart that the crypto trade has slowed down, with buyers maintaining control at lower levels.
The Stochastic Oscillators have entered the overbought region, indicating that bullish momentum continues to dominate market activity. Meanwhile, the Bollinger Bands reveal initial signals of an emerging bullish structure, suggesting rising trader confidence and an increase in short-term buying strength throughout the broader market framework.
Earn Up To 43% APY 🔥 (As of Now)
Don’t miss out on high-yield opportunities — stake your tokens today and maximize your returns!
Stake Now: [wallstmemes.com/en/dashboard](https://wallstmemes.com/en/dashboard)
Buy Now: [wallstmemes.com](https://wallstmemes.com)
$WSM community, we saw your Tweets! 👏$WSM / $USDT is now tradeable on #Bybit Perpetuals.
— Bybit (@Bybit_Official) October 13, 2023
Trade here: https://t.co/le4XyVyXaZ
Also want your project listed? Share your suggestions here:https://t.co/W7EWJVVNV5 https://t.co/XgXoL7g0rF