Wall Street Memes (WSM) Price Waves Low, Set to Climb Higher
Estimated Reading Time: 3 minutes
Don’t invest unless you’re prepared to lose all the money you invest. This is a high-risk investment and you are unlikely to be protected if something goes wrong. Take 2 minutes to learn more
Wall Street Memes Price Prediction – October 28
Following a brief market lull, Wall Street Memes (WSM) shows early signs of accumulation as long-term investors capitalize on discounted prices. The subdued volatility suggests strategic positioning, anticipating gradual appreciation driven by community strength and expanding project fundamentals over time.
After a short market lull, Wall Street Memes (WSM) shows early signs of accumulation as long-term investors strategically capitalize on discounted prices. The subdued volatility reflects sustained confidence, with participants positioning for gradual appreciation. Strengthening fundamentals and deepening community engagement suggest WSM could soon transition from consolidation to a stable long-term growth phase favoring patient investors.
WSM/USD Market
Key Levels
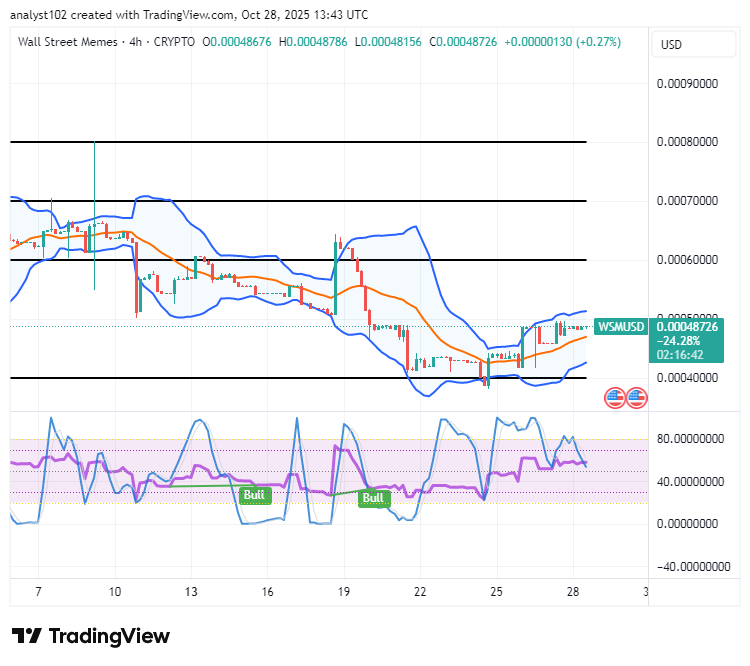
Resistance levels: $0.0006, $0.0007, $0.0008
Support levels: $0.0004, $0.0003, $0.0002
WSM/USD – 4-hour Chart
On the WSM/USD medium-term chart, it shows that the crypto-economic trade waves are low, settling to climb higher in no time.
The Bollinger Bands are steadily expanding upward, reflecting intensified volatility and a controlled upward stretch from the upper boundary area. The Stochastic Oscillators have gently oscillated downward, positioning above the point of 40, indicating potential re-accumulation before another wave of bullish pressure gains stronger technical confirmation ahead.
Could Wall Street Memes (WSM) Sustain Momentum to Confirm a Breakout From Its Current Low-Wave Formation?
Wall Street Memes (WSM) could sustain momentum if buying volume increases and price action maintains stability above near-term support. A breakout from the low-wave formation may attract renewed investor interest, reinforcing a potential medium-term bullish continuation pattern.
Wall Street Memes (WSM) could sustain momentum if buying volume increases and price stability holds above near-term support. However, traders should remain cautious, as a steady downside drift remains possible in the short term. Despite this, broader sentiment and accumulating investor confidence suggest that long-term upward momentum is likely to strengthen substantially as fundamentals mature.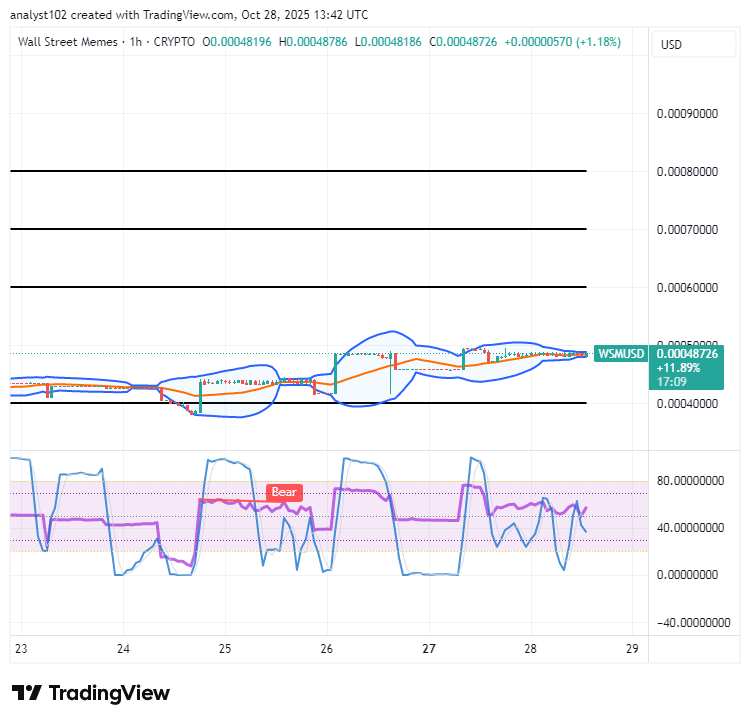
WSM/USD 1-hour chart
The WSM/USD 1-hour chart showcases that the crypto market waves low, settling to climb higher.
The Stochastic Oscillators are systemically turning downside with lesser moves in a way that suggests the gathering momentum is being executed by bulls. The Bollinger Bands display narrower candles within the trend lines, indicating mild compression ahead of a potential bullish expansion phase.
$WSM community, your Tweets didn’t go unnoticed!
$WSM / $USDT is officially live for trading on #Bybit Perpetuals.
$WSM community, we saw your Tweets! 👏$WSM / $USDT is now tradeable on #Bybit Perpetuals.
— Bybit (@Bybit_Official) October 13, 2023
Trade here: https://t.co/le4XyVyXaZ
Also want your project listed? Share your suggestions here:https://t.co/W7EWJVVNV5 https://t.co/XgXoL7g0rF