Wall Street Memes (WSM) Trade Forms Basis, Fueling Buying
Estimated Reading Time: 3 minutes
Don’t invest unless you’re prepared to lose all the money you invest. This is a high-risk investment and you are unlikely to be protected if something goes wrong. Take 2 minutes to learn more
Wall Street Memes Price Prediction – September 14
Over a couple of sessions, the middle trend line of the Bollinger Bands has been instrumental in curbing extended fall-offs, given that the Wall Street Memes coin consistently forms a strong basis around $0.0005, thereby fueling steady and renewed buying momentum.
The Wall Street Memes coin is holding a firm base near $0.0005, signaling resilience at this critical support level. This stable footing has sparked steady, renewed buying momentum, with indicators suggesting that market participants are positioning for potential upward continuation.
WSM/USD Market
Key Levels
Resistance levels: $0.0006, $0.0007, $0.0008
Support levels: $0.0004, $0.0003, $0.0002
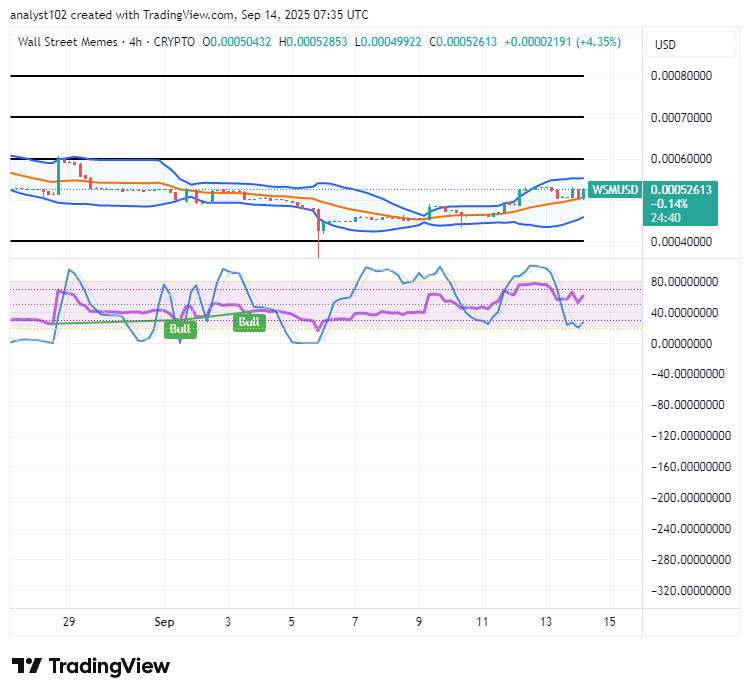
WSM/USD – 4-hour Chart
The WSM/USD medium-term chart reveals that crypto-economic trade forms a basis, fueling buying traits.
The Stochastic Oscillators have dipped into the oversold region, clearly signaling that buying moves are on the verge of recouping strongly. The Bollinger Band trend lines are positioned slightly to the northward, steadily keeping low stands with underlying supportive momentum intact.
Does the Crypto-Economic Trade Forming a Solid Basis Indicate Fueling Sustained Buying Traits Ahead?
The WSM/USD trade, forming a solid basis, strongly suggests sustained buying traits, as rising technical momentum steadily builds, thereby reinforcing potential upward continuation and further strengthening overall market confidence alongside long-term investor sentiment.
The WSM/USD market structure indicates that a firm base is gradually being established, aligning with strengthening technical momentum. This reinforces the likelihood of sustained buying activity, as market participants recognize renewed confidence. With accumulation patterns solidifying, prospects for upward continuation remain favorable, supporting long-term investor sentiment and broadening overall bullish positioning across the market.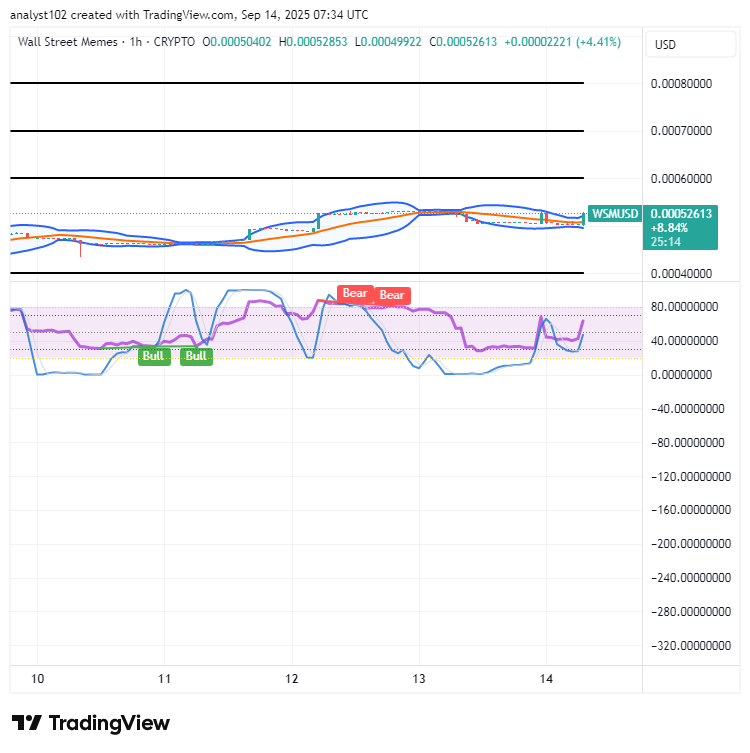
WSM/USD 1-hour chart
The 1-hour chart of the WSM/USD market showcases that the crypto-economic trade forms a basis, fueling buying.
The Stochastic Oscillators are in a northbound-swerving mode, clearly showing that bulls are firmly taking charge on a preparatory upward pattern. The Bollinger Bands are being somewhat compressed back to the downside at a slow yet steady pace, maintaining supportive market signals overall.
Enjoy Up To 43% APY Limited Offer Available (as of the moment of posting)
Stake Right Now ➡️ [https://wallstmemes.com/en/dashboard](https://wallstmemes.com/en/dashboard) Buy Directly ➡️ [https://wallstmemes.com](https://wallstmemes.com)
🔥 Up To 43% APY Now Available 🔥
— Wall Street Memes (@wallstmemes) October 8, 2023
(at the time of posting)
Stake Now ➡️ https://t.co/X031FQo0bW Buy Now ➡️ https://t.co/6zkwWf1VRF pic.twitter.com/o9qrY1zJn8