Wall Street Memes (WSM) Trade Is Stable, With Bulls Leading
Estimated Reading Time: 4 minutes
Don’t invest unless you’re prepared to lose all the money you invest. This is a high-risk investment and you are unlikely to be protected if something goes wrong. Take 2 minutes to learn more
Wall Street Memes Price Prediction – October 16
Wall Street Memes (WSM) maintains steady traction against the U.S. dollar, reflecting resilient buyer interest amid fluctuating sentiment. The token’s stability highlights growing investor confidence as bullish momentum continues to offset minor pullbacks within the short-term market structure.
Wall Street Memes (WSM) maintains steady traction against the U.S. dollar, showcasing firm buyer dominance despite brief market fluctuations. The sustained bullish momentum reinforces investor confidence, suggesting upward potential remains intact. Traders are advised to exercise caution against shorting positions, as the underlying strength could trigger swift rebounds and unexpected upward surges in price action.
WSM/USD Market
Key Levels
Resistance levels: $0.0008, $0.0009, $0.001
Support levels: $0.0005, $0.0004, $0.0003
WSM/USD – 4-hour Chart
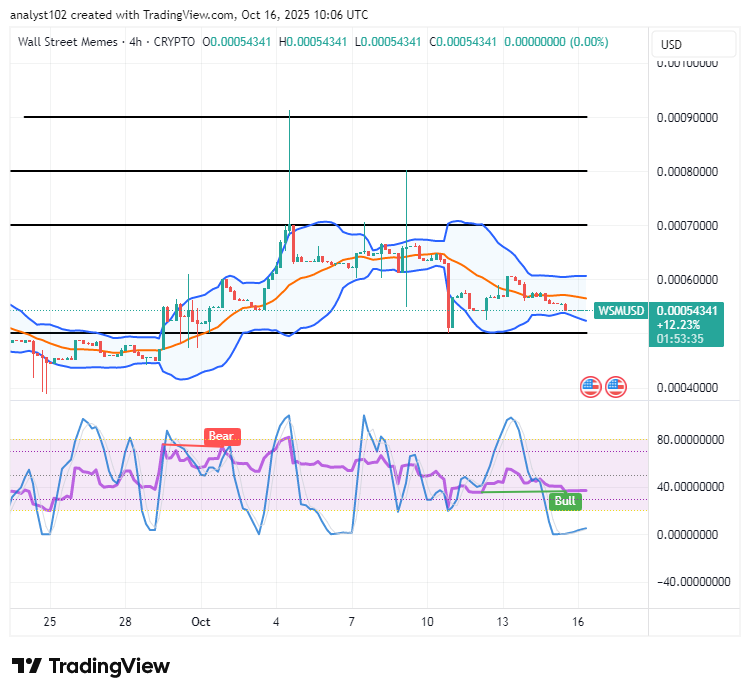
It is on the WSM/USD medium-term chart that the crypto-economic trade remains stable, with bulls leading in most active promissory actions.
The Bollinger Bands currently span between approximately $0.0006 and $0.0005, with candlesticks forming near the mid-to-lower range, reflecting weakened volatility and a potential setup for a bullish reversal. The Stochastic Oscillators are deepening in the oversold region, preparing to cross upward, which could signal an imminent rebound and renewed buying momentum.
Can Wall Street Memes (WSM) Sustain Its Bullish Momentum and Stability Against Mounting Market Pressures?
Wall Street Memes (WSM) continues to display resilient price behavior, maintaining its bullish course despite minor fluctuations. The sustained upward pressure reflects strong market confidence, suggesting that bulls remain firmly positioned to defend key support zones against any short-term downside attempts.
Wall Street Memes (WSM) continues to exhibit strong bullish resilience, holding firm despite brief consolidations. The consistent price structure suggests that any lower range-bound zones may present favorable buying opportunities. Traders could strategically accumulate positions within these potential dips, anticipating renewed upward momentum as bullish sentiment sustains dominance across the short-term market outlook.
WSM/USD 1-hour chart
The WSM/USD 1-hour chart reveals the crypto-economic market remains stable, with bulls leading.
The Stochastic Oscillators remain deeply positioned within the oversold zone, suggesting heightened potential for a swift upside reversal as accumulating buying pressure gains traction. Concurrently, the Bollinger Bands exhibit early indications of a bullish formation, signaling improving market sentiment and reinforcing short-term demand strength across the trading framework.
BIGTIMEUSDT & WSMUSDT Contracts Now Live on Bybit!
Unlock fresh trading possibilities with up to 25x leverage. Additionally, they’re integrated into the Bybit Futures Grid Bot for automated strategies. Seize the momentum and start trading these dynamic pairs today!
🚀 BIGTIMEUSDT & WSMUSDT Contracts now on Bybit!
— Bybit (@Bybit_Official) October 12, 2023
Dive into new trading opportunities with 1-25x leverage. Plus, they’re now on Bybit Futures Grid Bot! Start trading now.
📈 BIGTIME: https://t.co/FAQlbhnzAh
📈 WSM: https://t.co/pb2y2AfMBE#CryptoTrading #Bybit