Wall Street Memes (WSM) Trade Reshapes, Invigorating Rises
Estimated Reading Time: 3 minutes
Don’t invest unless you’re prepared to lose all the money you invest. This is a high-risk investment and you are unlikely to be protected if something goes wrong. Take 2 minutes to learn more
Wall Street Memes Price Prediction – July 29
It is now more visibly practical that the Wall Street Memes coin trade reshapes its stances against the valuation of the American fiat currency, invigorating rises around $0.0007, making the financial status of the pairing instruments keep the potentiality of securing sudden bounce-offs thereafter.
The WSM/USD market, with a pricing level showcased by the candlestick formation around $0.00070546, reinforces the necessary conditions indicating that a reversal is gradually taking shape—signaling early-stage accumulation for long-term position holders to remain alert ahead of a potential resurgence that could prove unprecedented in both magnitude and volatility. Momentum indicators are beginning to stabilize, further validating a foundational shift toward a bullish reaccumulation phase.
WSM/USD Market
Key Levels
Resistance levels: $0.0008, $0.0009, $0.001
Support levels: $0.0006, $0.0005, $0.0004
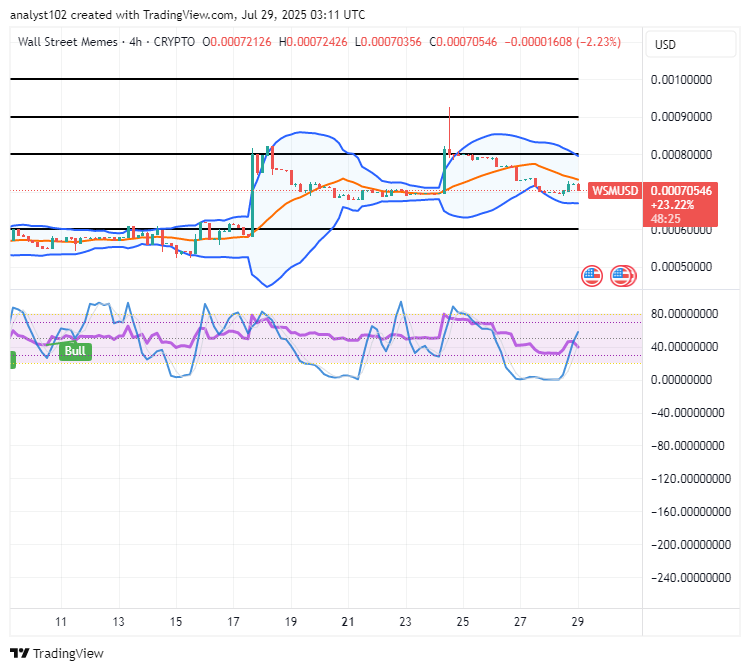
WSM/USD – 4-hour Chart
The medium-term chart of the WSM/USD trade reveals that the crypto-economic market currently reshapes its basis, invigorating rises in the settling.
The stochastic oscillators have initiated another round of upward swerving attempts from the depth of the oversold region, currently positioned gently across the point of 40, hinting at a latent bullish divergence. The Bollinger Bands indicators between the middle and lower bands now embody the trade zones, enclosing a smaller bearish candlestick in formation within a tightening volatility squeeze.
Given the current minor bearish candlestick in WSM/USD, is further downward momentum technically anticipated?
Despite the minor bearish candlestick in WSM/USD, technical indicators suggest a 75% likelihood of bullish recovery as the price reshapes along its baseline and invigorates upward momentum, with only a 15% chance of further decline due to low-volume short-term retracement.
Long-term position takers are encouraged to remain focused, as potential swing opportunities may emerge between the middle and lower Bollinger Bands—indicating a preparatory phase for accumulation ahead of a broader bullish continuation.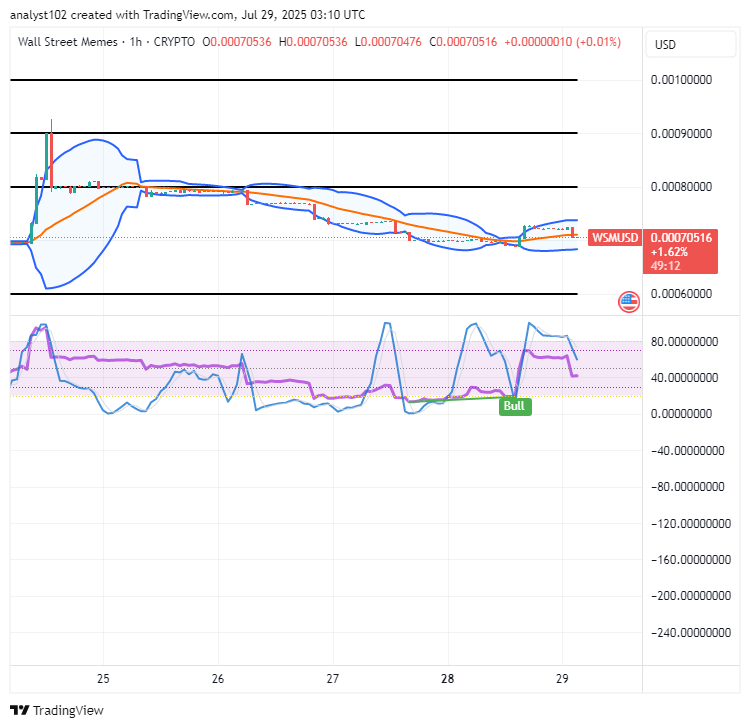
WSM/USD 1-hour chart
The 1-hour chart of the WSM/USD trade mirrors that the short-term crypto market reshapes, invigorating rises in its inputting pattern.
The Bollinger Bands are, in a way, trying to make up with a bullish flag-shaped formation, steadily consolidating around the $0.0007 mark with narrowing volatility pressure. The stochastic oscillators are now swerving in waves based on the platform of a confirmed bullish signal, hinting at an impending directional breakout.
$WSM community, we acknowledged your coordinated Tweets!
$WSM / $USDT is now officially tradeable on #Bybit Perpetual Contracts with increased market depth.
Trade here: https://i.bybit.com/1Wab4K3z
$WSM community, we saw your Tweets! 👏$WSM / $USDT is now tradeable on #Bybit Perpetuals.
— Bybit (@Bybit_Official) October 13, 2023
Trade here: https://t.co/le4XyVyXaZ
Also want your project listed? Share your suggestions here:https://t.co/W7EWJVVNV5 https://t.co/XgXoL7g0rF