Wall Street Memes (WSM) Trade Rises, Momentum Waxes
Estimated Reading Time: 3 minutes
Don’t invest unless you’re prepared to lose all the money you invest. This is a high-risk investment and you are unlikely to be protected if something goes wrong. Take 2 minutes to learn more

Wall Street Memes Price Prediction – August 14
Wall Street Memes (WSM) trading activity advances, with buying pressure intensifying to suggest strengthened bullish impulses and potential continuation toward higher technical thresholds in upcoming sessions, as the crypto-economic trade rises and its momentum waxes.
Wall Street Memes coin is now advancing robustly against the American currency, with sustained buying pressure reinforcing bullish impulses and positioning the market to imminently override prevailing bearish sentiment.
WSM/USD Market
Key Levels
Resistance levels: $0.0008, $0.0009, $0.001
Support levels: $0.0005, $0.0004, $0.0003
WSM/USD – 4-hour Chart
The WSM/USD medium-term chart demonstrates that the crypto-economic trade rises in its inputting style with its momentum waxing steadily.
The stochastic oscillators are positioned northbound, extending their moves into the overbought region. The Bollinger Bands remain narrowly aligned eastward, closely trailing just beneath the $0.0006 trade line, indicating compressed volatility ahead of a potential breakout expansion.
Is Wall Street Memes (WSM) Poised for Sustained Gains as Momentum Strengthens?
From the technical composure of the bargaining stances of Wall Street Memes against the US dollar so far, a promissory upside potential appears ideal for long-term purchasers seeking sustained value growth and strategic portfolio gains over extended market cycles, given that the base instrument currently rises and its momentum waxes unshakably.
From the prevailing market alignment of Wall Street Memes relative to the US dollar, reinforced accumulation trends and resilient upward drives project a favorable long-term capital appreciation outlook, as persistent price elevation and durable kinetic forces underpin extended growth trajectories for strategic investors.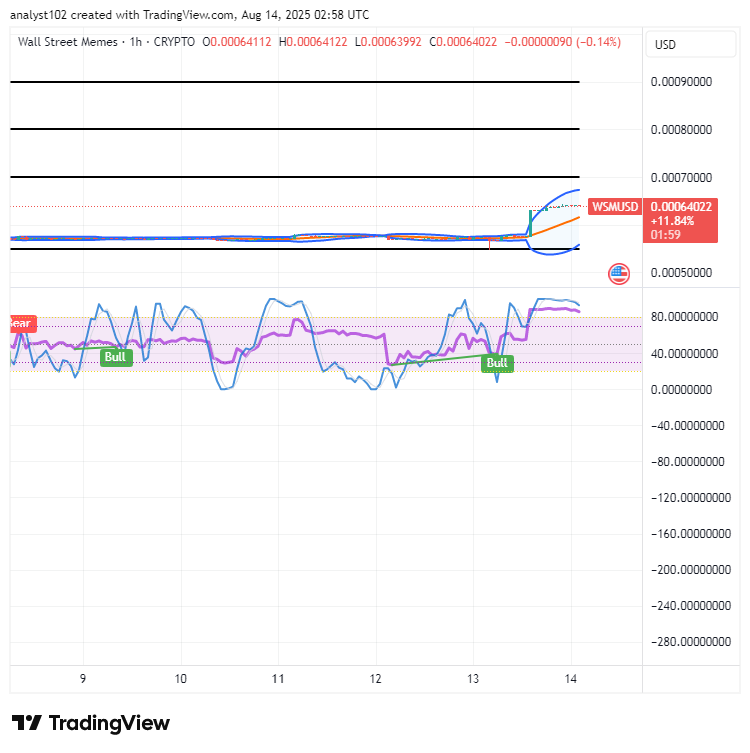
WSM/USD 1-hour chart
The 1-hour chart of the WSM/USD market is rising in output, with its momentum waxing higher.
The Bollinger Bands are expanding forcefully northward, signaling a gradual erosion of sellers’ influence. Stochastic oscillators remain in the overbought region, reflecting buyers’ strategic positioning in alignment with the accelerating upward momentum of the base cryptocurrency.
Explore fresh trading possibilities with 1–25x leverage, now available on Bybit Futures Grid Bot. Don’t miss out—start trading today.
🚀 BIGTIMEUSDT & WSMUSDT Contracts now on Bybit!
— Bybit (@Bybit_Official) October 12, 2023
Dive into new trading opportunities with 1-25x leverage. Plus, they’re now on Bybit Futures Grid Bot! Start trading now.
📈 BIGTIME: https://t.co/FAQlbhnzAh
📈 WSM: https://t.co/pb2y2AfMBE#CryptoTrading #Bybit