Wall Street Memes (WSM) Trades Poise, Stabilizing Rises
Estimated Reading Time: 4 minutes
Don’t invest unless you’re prepared to lose all the money you invest. This is a high-risk investment and you are unlikely to be protected if something goes wrong. Take 2 minutes to learn more
Wall Street Memes Price Prediction – March 28
Striving for efforts to put proper forcing moves into normal shapes in the market worth of the Wall Street Memes coin against the material worthiness of the US currency has been increasingly intensifying, given that the base trades now poise for positive pricing actions, stabilizing rises in its signal settings.
The current behavior of the stochastic oscillators in the Wall Street Memes (WSM) market indicates a period of consolidation, suggesting that significant upward momentum may require additional time to materialize. Investors are advised to exercise patience, allowing the market to stabilize and potentially initiate a recovery. Committing funds during this phase should be approached cautiously, with an understanding that the market may need time to regain strength for a sustained upward trajectory.
WSM/USD Market
Key Levels
Resistance levels: $0.002, $0.0025, $0.003
Support levels: $0.0008, $0.0006, $0.0004
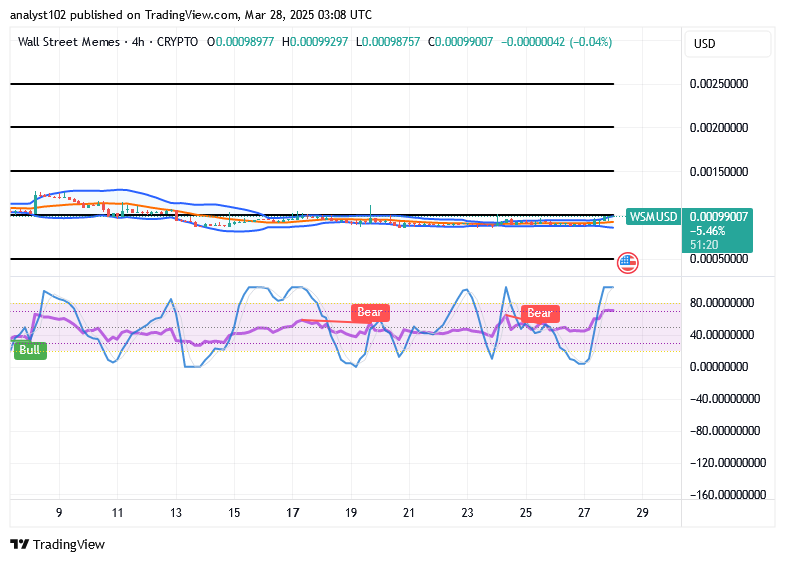
WSM/USD – 4-hour Chart
The medium-term chart of the WSM/USD price showcases that the crypto-economic trades poise for volatility indexes, stabilizing rises in inputs.
As the Wall Street Memes market bulls try to indicate that pushing for rallies may be approaching, there has been a modest widening of the gap between the trend lines of the Bollinger Bands indicators. Given that the stochastic oscillators have moved northward into the overbought area, which may provide a warning against witnessing steady increases for some time, they are still categorized under a low-weighted bearish signal arrangement.
Is there any indication that the WSM/USD market will soon break out of its bottom versus the lower Bollinger Band indicator zone?
Having a suddenly driven loss of stances at the spot of the indicator of the lower Bollinger Band appears unrealistic, given that the WSM/USD markets poise for recovery inputs, stabilizing rises in its pricing movement pattern.
Given the current circumstances, the trend lines of the Bollinger Bands indicators must extend eastward while maintaining the trade line of $0.001 in focus if the market is still required to continue elongating its business lines in range-bound forms.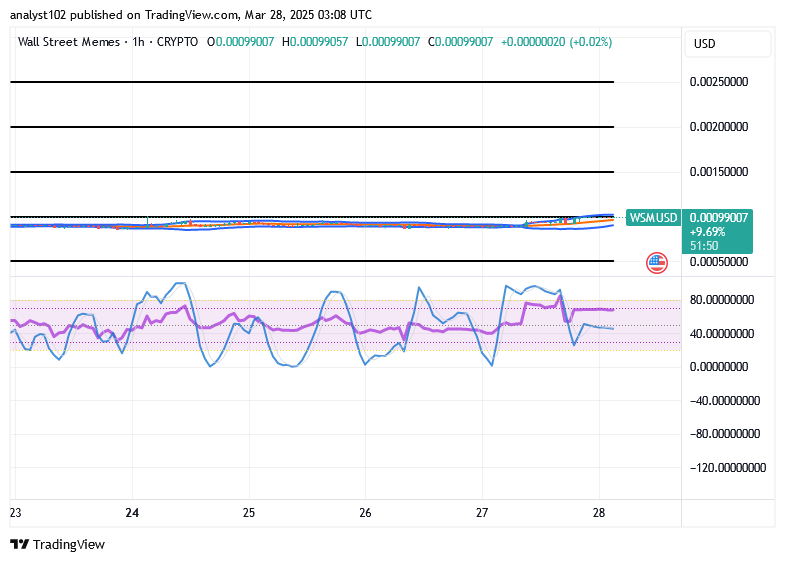
WSM/USD 1-hour chart
The 1-hour chart of the WSM/USD prices now displays that the short-term movement outlook of the crypto-economic markets is poised for a rebound, stabilizing rises in its signal setup.
Technically speaking, the hourly setup chart shows that variant candlesticks have been exhibiting lower highs rather than negative ones around the Bollinger Bands indicators’ stretching pattern. The stochastic oscillators are currently reverting to its swerving system from the 40-point thresholds to potentially provide a re-boosting signal sense to the circumstance.
Bullish and bearish market activity indicates that Wall Street Memes (WSM) is forming a strong foundation that might result in a breakout or reversal.
📖 Wall Street Memes (WSM) Trade Finds a Base, Making Spirals
— Leon Trade (@Leon_esnm) March 15, 2025
📈 Wall Street Memes Price Prediction – March 14
Market behavior between bulls and bears suggests that Wall Street Memes (WSM) is establishing a solid base, potentially leading to a reversal or breakout.
Key… pic.twitter.com/dirKDGMzMD