Wall Street Memes (WSM/USD) Price Adds Muscles, Climbs Up
Estimated Reading Time: 4 minutes
Don’t invest unless you’re prepared to lose all the money you invest. This is a high-risk investment and you are unlikely to be protected if something goes wrong. Take 2 minutes to learn more

Wall Street Memes Price Prediction – May 16
The trade lines around $0.001 have been garnering more signal notes making it the major retarding bargain zones that the Wall Street Memes coin accumulators would have to breath into their levels stronger than the market’s worth of the US currency in order to produce a path-wall fostering stable increases, given that the market now adds muscles, climbs steadily in their moving pattern.
The WSM/USD market is demonstrating predominantly resilient and constructive behavior, with price actions showing dynamic upward-and-downward movements around the trend lines of the Bollinger Bands. This activity highlights a strong engagement between bulls and bears, where bullish momentum continues to exert significant influence. Notably, selling pressure appears to be waning, particularly toward the lower band regions, suggesting that bearish forces are losing traction. While a minor degree of volatility persists, it remains largely contained and insufficient to disrupt the overall optimistic market tone.
WSM/USD Market
Key Levels
Resistance levels: $0.0015, $0.002, $0.0025
Support levels: $0.0005, $0.0004, $0.0003
WSM/USD – 4-hour Chart
The WSM/USD 4-hour chart depicts that the crypto-economic price adds muscles and climbs steadily in their moving pattern.
The Bollinger Bands are extending upward above $0.001, hinting at renewed bullish momentum. This suggests a decent buy re-entry opportunity as the price approaches supportive zones. Minor lower highs may still form short-term, but overall structure remains favorable. The stochastic oscillators are moving into oversold territory, backing potential upward reversal. Indicators lean about 90% toward a bullish re-engagement despite slight consolidation signs.
As the WSM/USD market is tending to break around $0.001, is it logical for sellers to find a shorting pace entry?
It won’t be too good technically for sellers to rely on most feeble moves tending to have features around $0.001, given that the WSM/USD’s price adds muscles and climbs steadily in their moving pattern.
The crypto market is showing strong upward momentum, with appreciation zones becoming more evident. Investor sentiment favors early staking, aligning with the prevailing bullish trend. Stable support levels could trigger sustained rallies and resistance breakouts. Overall, most indicators point to a rising cycle with growing confidence and value potential.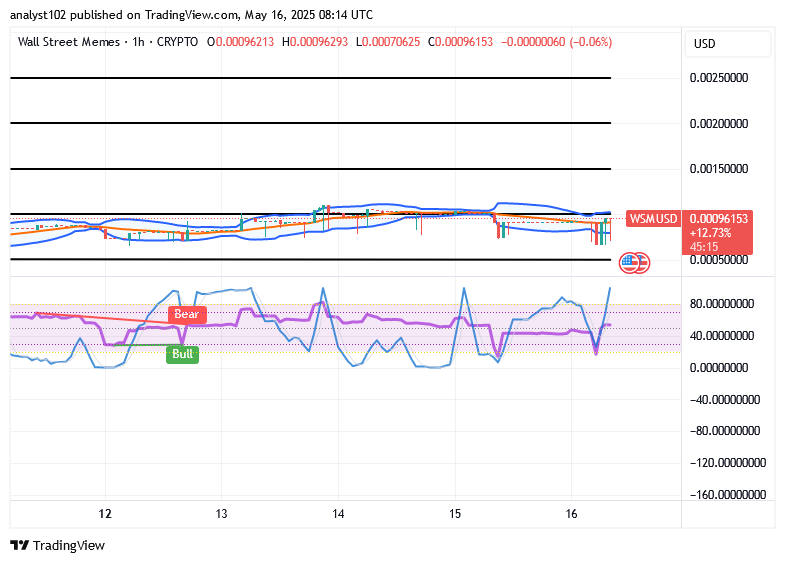
WSM/USD 1-hour chart
The 1-hour chart reveals that crypto-economic price adds muscles, climbs steadily in their moving pattern.
Most prominent candlesticks are aligning predominantly in a northward trajectory along the Bollinger Bands’ trend lines, reflecting volatility compression within a structured price channel. This positioning suggests bullish price adherence near upper range boundaries. Concurrently, the stochastic oscillators are maintaining steady upward momentum, reinforcing buying strength. The combined signals point to a technically supportive environment favoring continued upside development.
Attention $WSM community: We’ve noted your feedback on Twitter.
$WSM/$USDT perpetual contracts are now live for trading on the Bybit platform.
$WSM community, we saw your Tweets! 👏$WSM / $USDT is now tradeable on #Bybit Perpetuals.
— Bybit (@Bybit_Official) October 13, 2023
Trade here: https://t.co/le4XyVyXaZ
Also want your project listed? Share your suggestions here:https://t.co/W7EWJVVNV5 https://t.co/XgXoL7g0rF