Wall Street Memes (WSM/USD) Price to Hike, Holding Ground
Estimated Reading Time: 3 minutes
Don’t invest unless you’re prepared to lose all the money you invest. This is a high-risk investment and you are unlikely to be protected if something goes wrong. Take 2 minutes to learn more
Wall Street Memes Price Prediction – January 30
In a bid of the principles of continuity, the Wall Street Memes has been seen letting to experience a feeble line of declines versus the pushing force of the US Dollar, as the crypto business price is settling to hike, holding ground.
With a confirmed bullish signal from the oscillators, it is plausible that the underlying asset is positioning itself with the necessary catalysts for a rapid recovery. From a psychological perspective, this presents an opportune moment for long-term investors to continue accumulating positions, capitalizing on potential rebounds despite prevailing market conditions.
WSM/USD Market
Key Levels
Resistance levels: $0.0012, $0.0017, $0.0022
Support levels: $0.0005, $0.0004, $0.0003
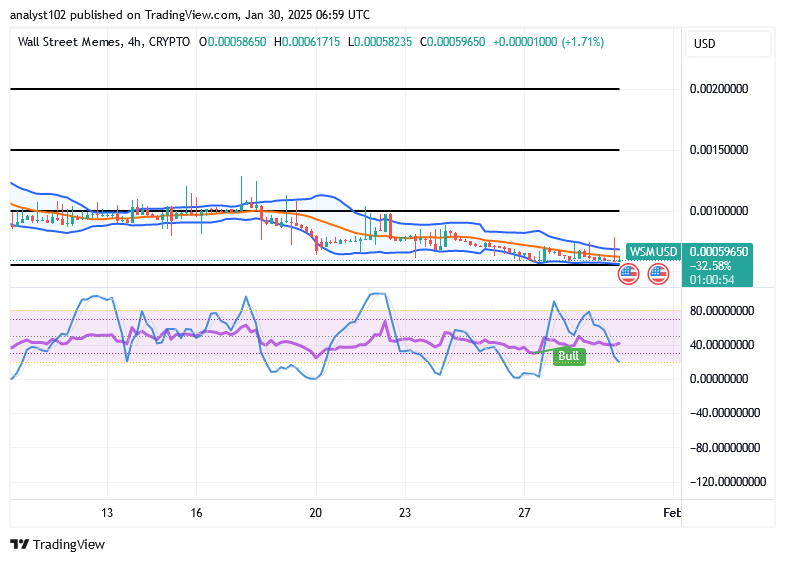
WSM/USD – 4-hour Chart
The WSM/USD market 4-hour chart reveals that the crypto-economic market is getting ready to hike, holding ground.
At the time of this piece, most of the indicators have compressed southward to considerable lower spots portending that the falling movements are on the verge of ending soon. As a result, it is now observed that the trend line of the Bollinger Band is positioned around $0.0006 or thereabouts with variant promissory price actions. The stochastic oscillators are already southbound-placed in the oversold region, portending a signal note to cease a further fall.
Is it an opportune time for short-term buyers to enter the WSM/USD market based on the current technical setup?
It is an opportune cycle for short-term purchasers to begin entering positions in the operations of the WSM/USD market, given that the crypto-economy has been more closely observed getting steady to hike, holding ground.
It is now highly probable that bulls will regain control near the $0.0006 price level in the near term. From a technical standpoint, it is advisable for traders, particularly those with a short-term outlook, to refrain from using large lot sizes when initiating positions, ensuring proper risk management during this phase of market uncertainty.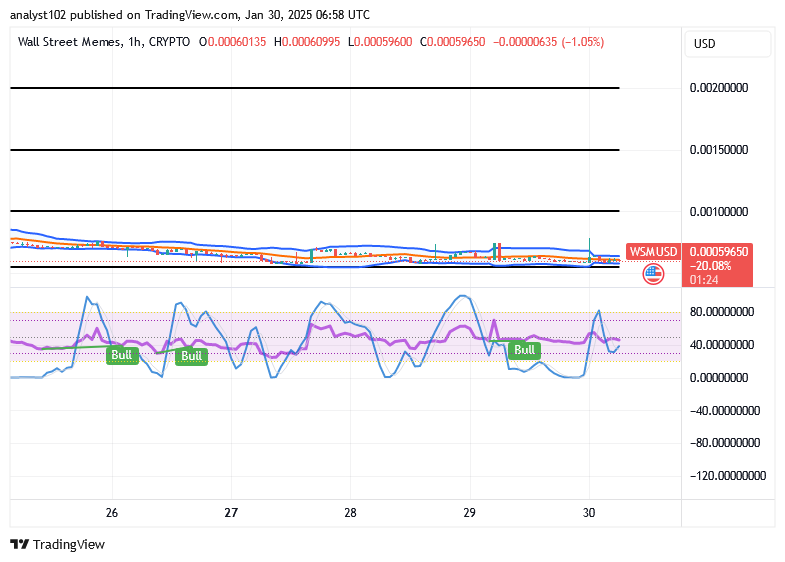
WSM/USD 1-hour chart
The 1-hour chart mirrors that the WSM/USD market is preparing to hike, holding ground.
From a technical perspective, as indicated by the hourly chart structure, the stochastic oscillators have maintained their oscillatory movement across varying levels, exhibiting bullish momentum. Meanwhile, the Bollinger Bands are reflecting an expanded range, suggesting that the market is likely to experience continued consolidation or sideways movement in the near term.
Trump Issues Executive Order to Transition from the Year of the Snake to the Year of the Eagle.
Trump signs order to change year of the snake to year of the eagle 🦅 https://t.co/g747rrUUna
— Wall Street Memes (@wallstmemes) January 30, 2025
Buy and stake WSM now!: Wall Street Meme (WSM)