ZRXUSD (0x) Bulls Lose Concentration at the $1.100 Significant Level
Estimated Reading Time: 2 minutes
Don’t invest unless you’re prepared to lose all the money you invest. This is a high-risk investment and you are unlikely to be protected if something goes wrong. Take 2 minutes to learn more

Free Crypto Signals Channel
ZRXUSD Analysis – Bulls Lose Concentration After Attaining $1.1000
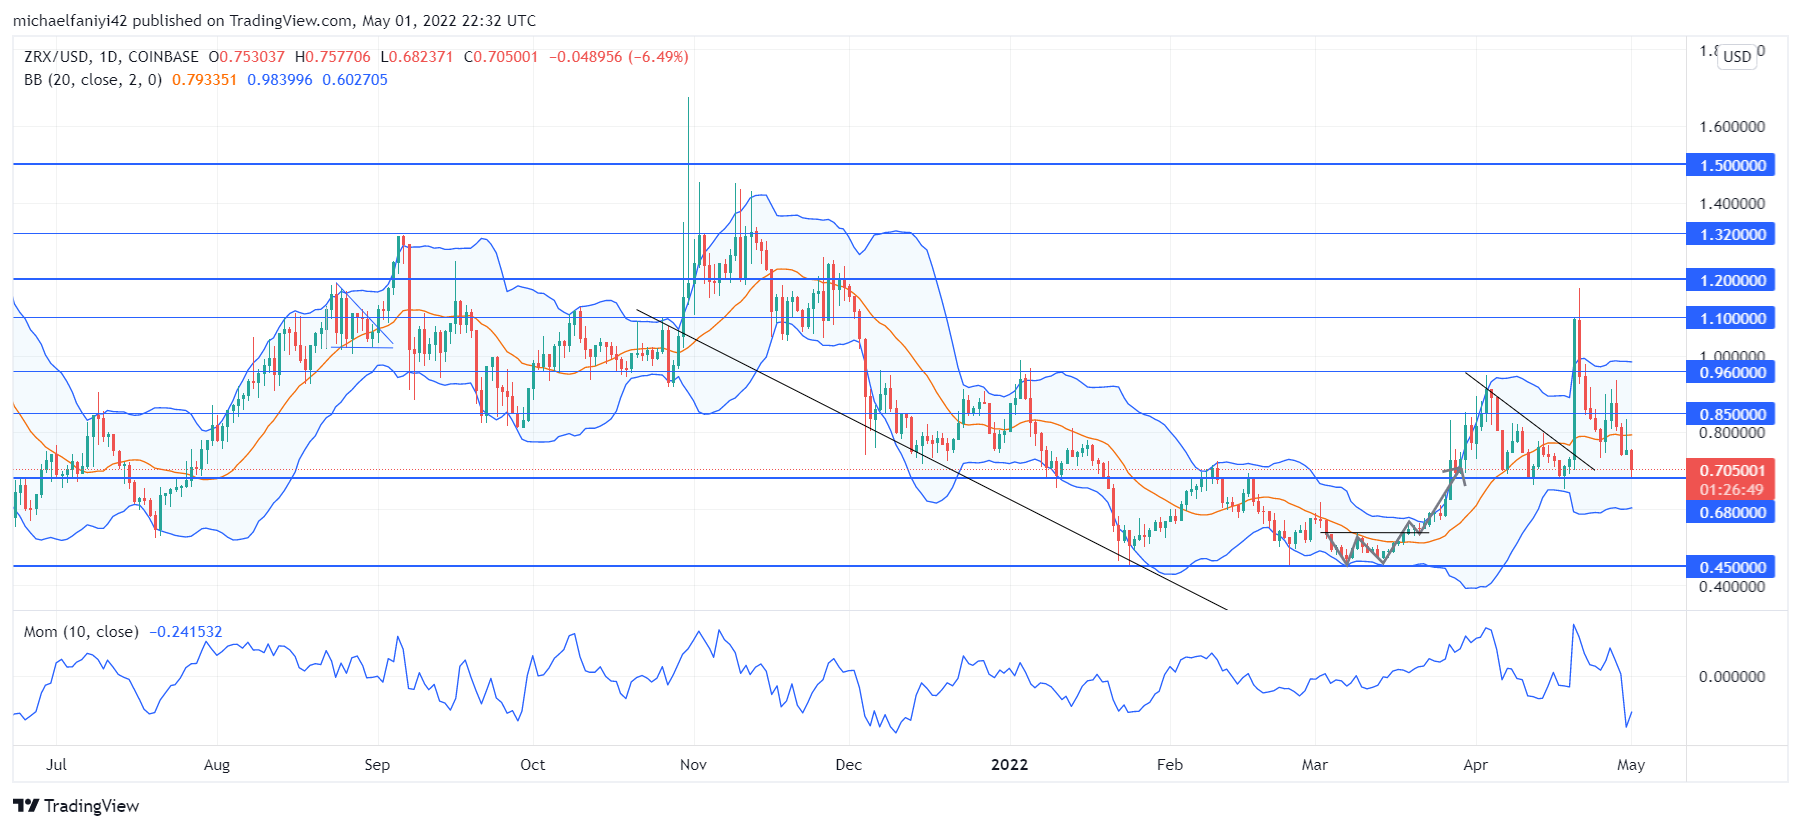
ZRXUSD bulls lose concentration after surging up to the $1.100 significant level. The loss of concentration leads to an immediate slump back towards the rallying zone of $0.6800. After a little before reaching the support level, the price jerked up. Bulls, on the other hand, lose concentration once more, and the market eventually falls back to the support level.
ZRXUSD Key Levels
Resistance Levels: $1.2000, $1.1000, $0.9600
Support Levels: $0.6800, $0.4500, $0.3000
The market buyers started building momentum from the consolidation between $0.6800 as resistance and $0.4500 as support. This consolidation spanned from early January to late March, which allowed ZRXUSD to store up momentum, which the bulls exploited. The price finally broke out on the 27th of March 2022. Thereafter, the price kept rising till it got to $0.9600, where the market was now pressured downwards to $0.6800.
This was an advantage to the bulls as this aided the April 20th upsurge. However, the buyers lose concentration just at the end of that upsurge. The result is that ZRXUSD drops with consecutive bearish candles. The Momentum chart has its line plunging steeply into a negative value. This shows a major drop in momentum. The candlesticks have dropped below the middle line of the Bollinger Band also.

Market Expectations
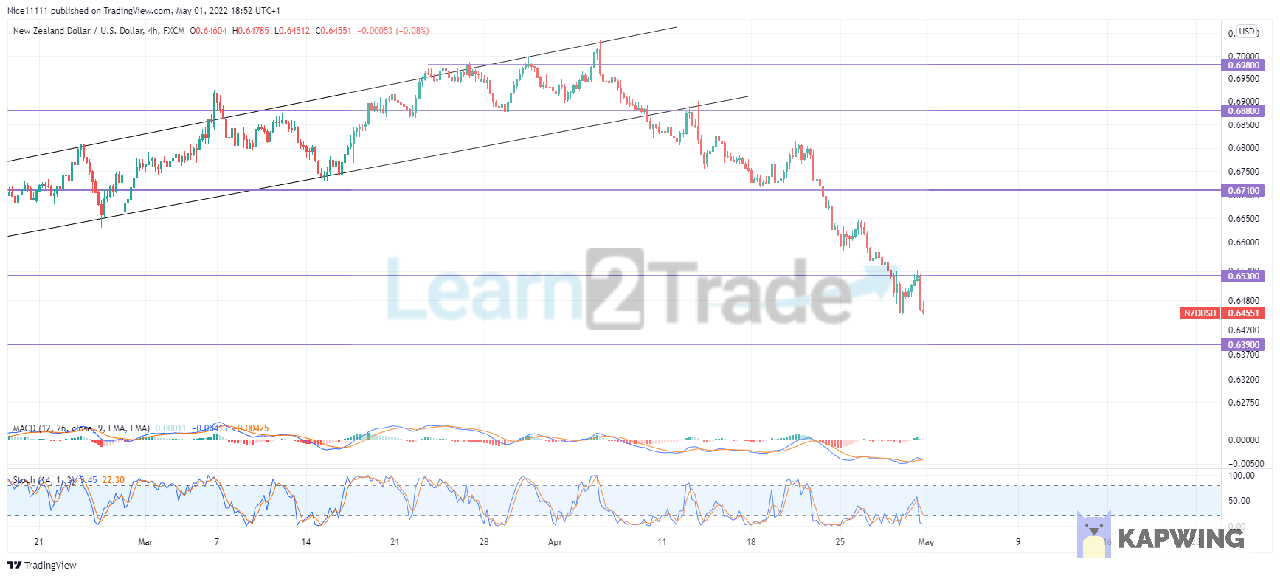
On the 4-hour chart, the price is now attempting to conform to a triangle pattern as it did previously, which led to an upsurge. As a result, the latest candlestick is rising towards the border of the triangle and trying to navigate the mid-line of the Bollinger Band. The Momentum chart shows the signal line as undulating. This means that the market’s momentum is fairly constant, despite the current rise in price. ZRXUSD will look to attack the $1.1000 price level again.
How To Buy Lucky Block
Note: Cryptosignals.org is not a financial advisor. Do your research before investing your funds in any financial asset or presented product or event. We are not responsible for your investing results.