Bitcoin (BTC) Price Prediction: BTC Dips Below the $68,000 Mark
Estimated Reading Time: 3 minutes
Don’t invest unless you’re prepared to lose all the money you invest. This is a high-risk investment and you are unlikely to be protected if something goes wrong. Take 2 minutes to learn more

Bitcoin (BTC) Price Prediction: May 29
Price action in the Bitcoin daily market recently visited the $70,000 mark. However, this triggered headwinds, and the market quickly regressed below this price level. Since then, the market has been dipping towards lower price levels. Today, price action in this market has further approached the $67,000 mark for support.
BTC/USDT Long-term Trend: Bullish (Daily Chart)
Resistance Levels: $68,000, $75,000, and $80,000.
Support Levels: $65,000, $60,000, and $55,000.
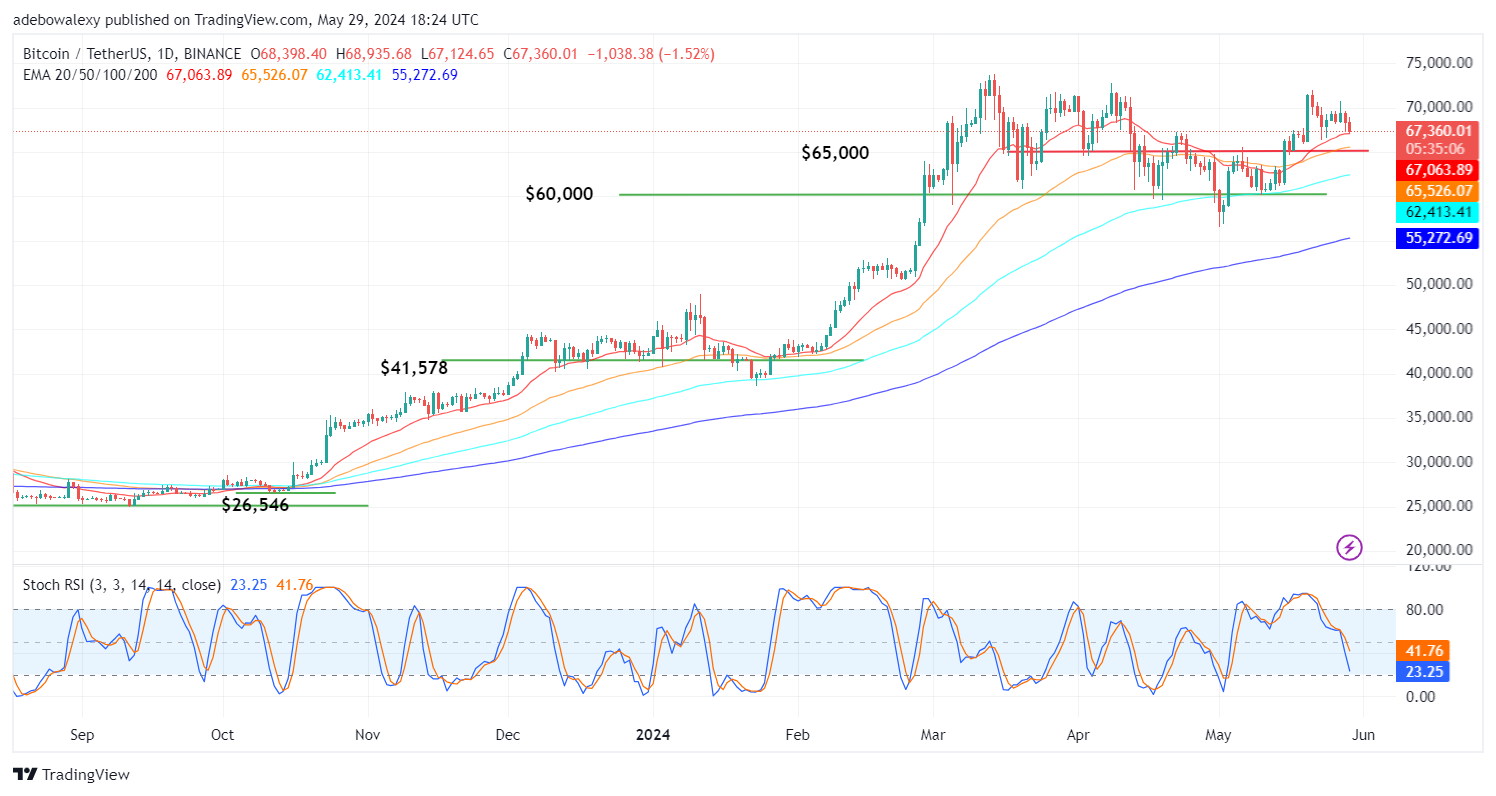
Based on activity in the BTCUSDT daily market, it appears that headwinds have grown stronger. This is evident as price action dipped towards the $67,000 mark with more momentum. The ongoing session has perched on the 20-day Exponential Moving Average (EMA) curve. Meanwhile, the Stochastic Relative Strength Index (SRSI) continues to descend towards the oversold region. Nevertheless, trading activity lies above all the EMA curves on this price chart.
Bitcoin Price Prediction: What Can Be Expected in the BTCUSDT Market?
The Bitcoin market is bearish at the moment, that’s for sure. However, signs emanating from technical indicators suggest that bears may not accomplish much in this market. While the SRSI lines have fallen a significant distance into the oversold region, price action can still be seen above the EMA indicator lines.
As a result, the last price candle can be seen just testing the closest of all the EMA lines. Consequently, this points out that the market may be close to finding support. Recently, price activity has dropped above the $65,000 mark. This consequently affirms the opinion that support may be located soon.
BTC/USDT Medium-term Trend: Bitcoin Bulls Are Resisting Further Price Declines (4H Chart)
As price action trickles down towards the $67,000 mark, it appears that buyers have regrouped at that psychological price level. A green price candle that appears more like a spinning top has appeared just at the 100-day EMA line. Also, the SRSI indicator lines are now in the oversold region. Meanwhile, a deflection can be noticed in the leading line of this indicator.
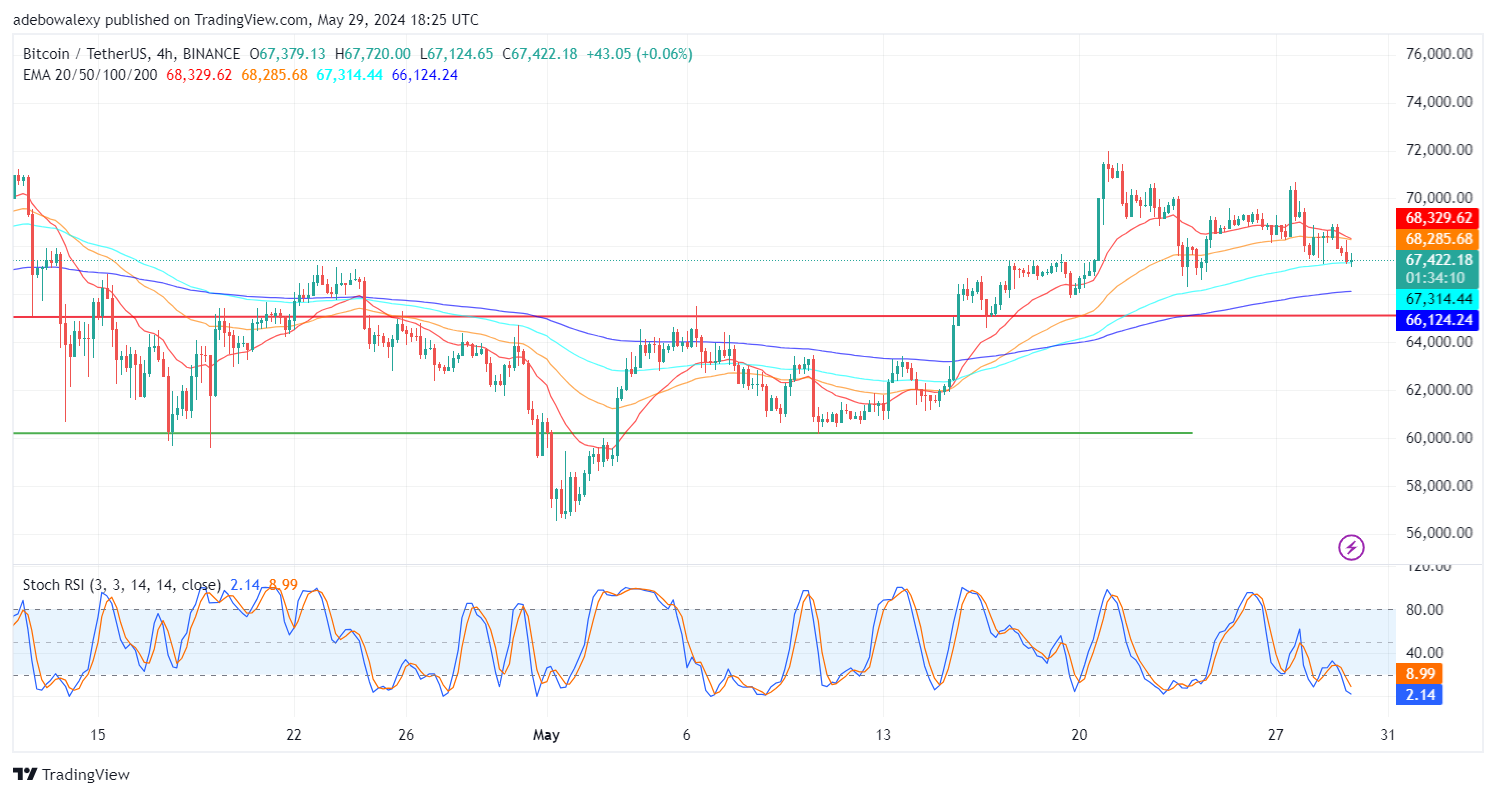
The last price candle on this chart suggests that market forces are at loggerheads. Likewise, the deflection in the leading line of the SRSI line affirms that upside forces are trying to initiate a trend reversal at this point. However, the convergence of the 20 and 50-day EMA lines above price action seems to be constituting downward pressure on price movement. Nevertheless, if more traders re-enter the market at this point, we may see a rebound towards the $70,000 mark.