Can Lucky Block (LBLOCK) Lead a New Bullish Wave?
Estimated Reading Time: 3 minutes
Don’t invest unless you’re prepared to lose all the money you invest. This is a high-risk investment and you are unlikely to be protected if something goes wrong. Take 2 minutes to learn more

Lucky Block (LBLOCK) has been capturing attention as its technical indicators suggest a potential shift toward bullish momentum. With market interest growing, the token appears poised to take advantage of its current positioning to initiate a strong upward movement. This analysis highlights key trends across the daily and 4-hour charts that underscore LBLOCK’s potential for growth.
Daily Chart Analysis: Stability With Bullish Indicators
On the daily chart, Lucky Block has maintained stability within a tightly constrained range. The Bollinger Bands reflect this consolidation, with the price consistently hovering around the midline. Consolidation phases like this often precede significant breakouts, providing traders with an opportunity to position themselves for upward momentum.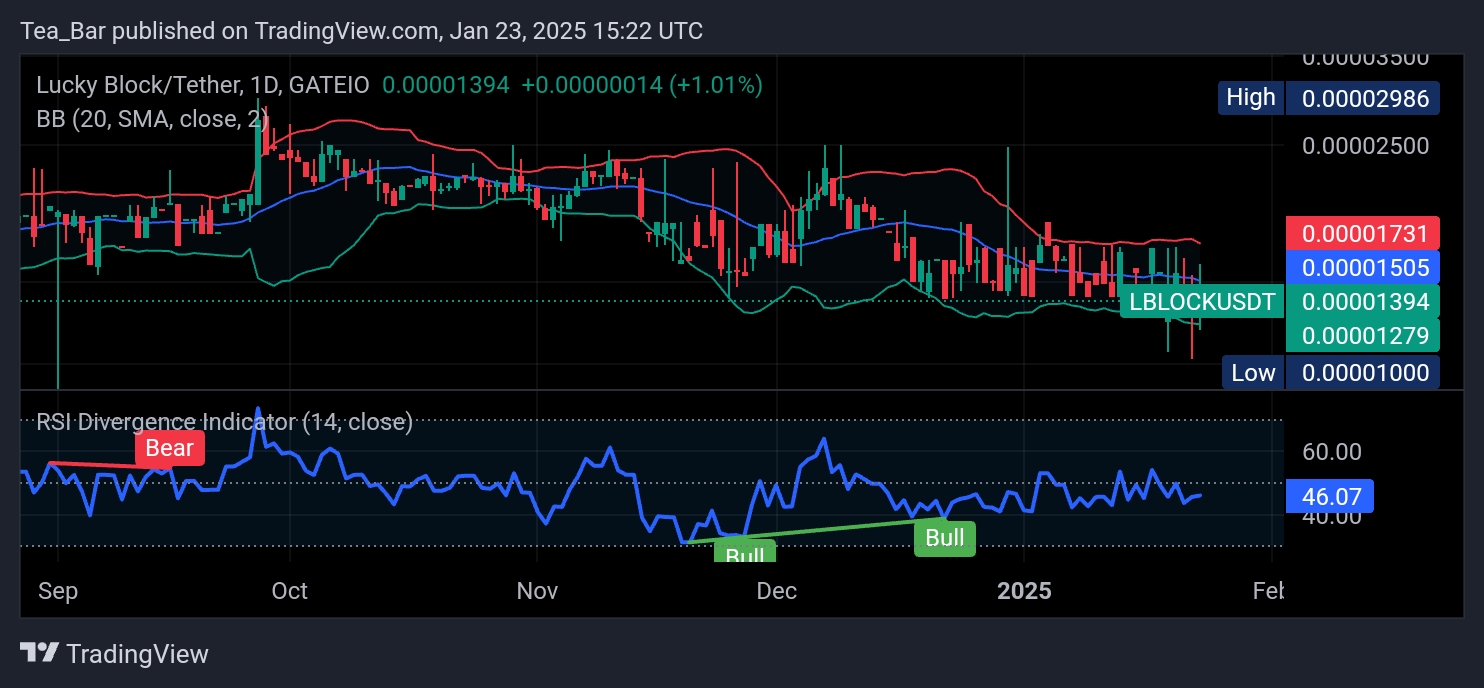 LBLOCKUSDT – Daily Chart
The RSI remains in a neutral zone, indicating that the token is not yet overbought and retains room for further growth. This balanced setup is often viewed as a positive sign by traders, as it suggests that Lucky Block is building a solid base for its next upward leg.
Additionally, the narrowing Bollinger Bands signal declining volatility, typically a precursor to sharp market movements. With bullish market sentiment on the rise, this could lead to significant gains for LBLOCK holders.
4-Hour Chart: Breaking Barriers to Unlock Growth
The 4-hour chart offers a more detailed view of LBLOCK’s current trajectory. Trading at $0.00001394, the token is edging closer to the immediate resistance level at $0.00001691. A breakout above this level could unleash significant bullish momentum, potentially propelling the price toward higher targets.
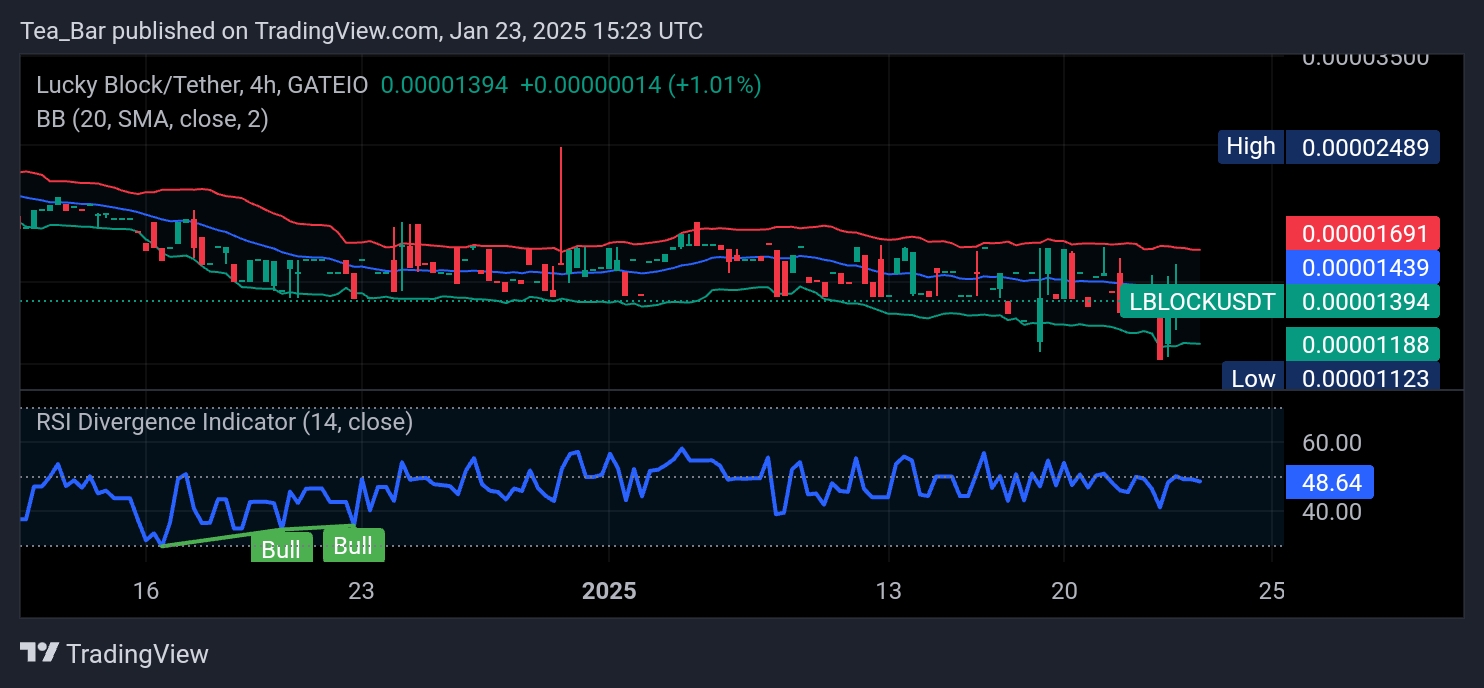
On the downside, the support level of $0.00001188 provides a strong safety net, ensuring that any temporary pullbacks remain limited. The RSI, currently at 48.64, reflects neutral market sentiment while leaving room for a positive trend to develop.
The Bollinger Bands on this timeframe also reveal tightening price action, often a sign of impending volatility. Coupled with the RSI Divergence Indicator flashing bullish signals, LBLOCK appears ready to capitalize on its momentum.
Bright Prospects for Lucky Block
Lucky Block’s recent price action and technical indicators paint an optimistic picture for its future. The token’s ability to maintain stability while gearing up for a breakout highlights its potential as a promising investment opportunity. If LBLOCK surpasses the $0.00001691 resistance, it could spark a sustained bullish rally that attracts further market participation.
You can purchase Lucky Block here. Buy LBLOCK.