Dash 2 Trade Price Prediction for Today, October 3: D2TUSD Price Begins Bullish Action
Estimated Reading Time: 3 minutes
Don’t invest unless you’re prepared to lose all the money you invest. This is a high-risk investment and you are unlikely to be protected if something goes wrong. Take 2 minutes to learn more
Dash 2 Trade Price Forecast: D2TUSD Price Begins Bullish Action (October 3)
D2TUSD‘s price begins its bullish action after completing the low dips. The crypto is trending upward at the moment and also sends a clear bullish signal that the bulls are buying. If the forces from buyers in the market should increase and sustain the coin prices above the 0.00644 supply mark, the bullish correction pattern may plunge prices to the $0.01000 supply level trend line. Hence, a turnaround and a buy trade signal for the coin investors.
Key Levels:
Resistance levels: $0.01000, $0.01100, $0.01200
Support levels: $0.00600, $0.00500, $0.00400
D2T (USD) Long-term Trend: Bullish (4H)
Despite the interruptions from the short traders, the Dash 2 Trade market still maintains a bullish trend in its long-term outlook. The bulls could not stop investing in the coin, so the general sentiment regarding the coin is bullish.
The bullish pressure on the crypto in the past few hours at the $0.00439 resistance level has sustained the coin price above the supply trend line in its recent high.
After completing the dip-lows by sellers, an additional effort was added by the bulls and the price of D2TUSD jumped up to a $0.00456 high mark above the EMA-9. This suggests an uptrend as well as an indication that the buy traders are really responding to the price actions in the market.
Thus, a sharp breakout and closure above the current correction phase at a $0.00456 high value could lead the price to retest the $0.00644 previous high neckline which will invalidate any bearish thesis and focus on the ultimate breakout to the upper resistance level.
Additionally, the momentum indicator shows that the price action of D2TUSD is in an uptrend, this implies that the coin price will continue its bullish action and this could drive the prices higher to hit the $0.01000 upper resistance trend line soon in its long-term view, thus, more gains and a clear buy signals for the coin holders.
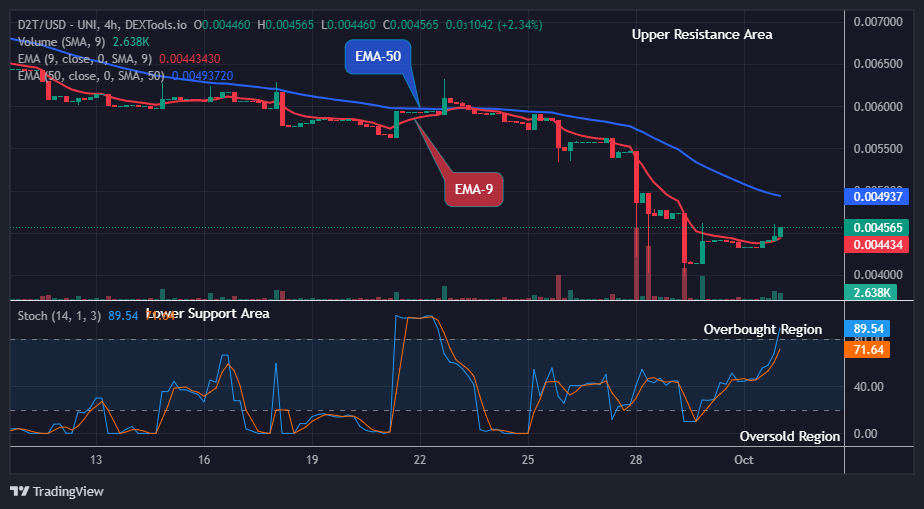
D2T (USD) Medium-term Trend: Bullish (1H)
Analyzing the chart below, the Dash 2 Trade pair remains strongly in an upward move in its medium-term time frame. We have also spotted a counter-trend line breakout in the direction of the bigger picture trend, which singles the potential end of a pullback and the start of a bullish action.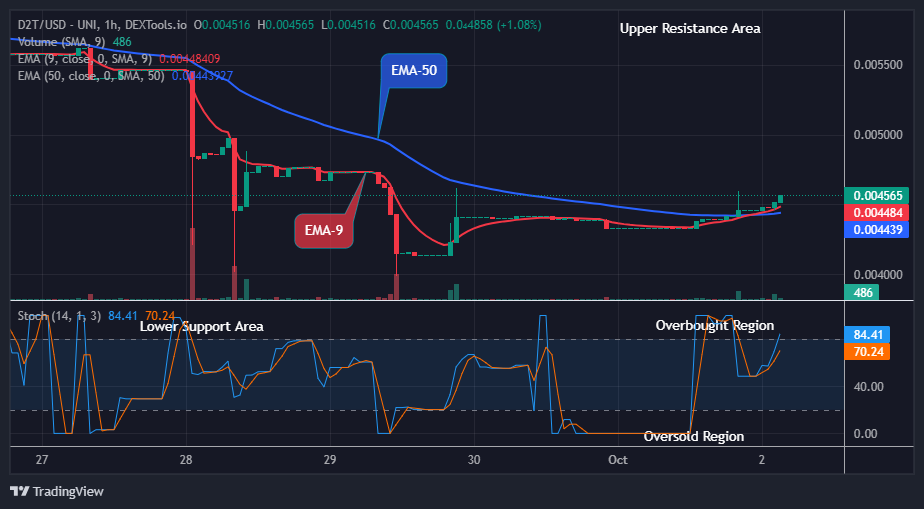
D2TUSD looks promising as buyers made a strong ride to the $0.00456 resistance mark above the two EMAs as the 1-hour chart opens today. This implies that the coin is actually been traded by the bulls at the moment.
A strong push by the long traders above the $0.00 previous high point with a 1-hour candle closing could signify a shift in the market dynamics.
Hence, with the price showing an uptrend on the daily stochastic, if the coin buyers manage to break the above the $0.00628 trend line, the market participants may witness a long bullish recovery rally and this may reach a high at the $0.01000 mark soon in its medium-term time frame.
Dash 2 Trade Development Update: Updated dependencies, improved private APIs, changed event timescales, and made a number of UI improvements and fixes.
Dash 2 Trade Development Update:
— Dash 2 Trade (@dash2_trade) September 26, 2023
26.09.2023
Improved private APIs, updated dependencies, adjusted event timeframes, and made various UI enhancements and fixes.
-Private API improvements for existing pages
-Various dependency updates and smaller fixes
-New logic for timeframe… pic.twitter.com/lrJ8rOROGe
Want a coin that has a huge potential for massive returns? That coin is Dash 2 Trade. Buy D2T now.