Dogecoin (DOGE) Price Prediction: DOGE/USDT Holds Tightly to Minimal Gains
Estimated Reading Time: 3 minutes
Don’t invest unless you’re prepared to lose all the money you invest. This is a high-risk investment and you are unlikely to be protected if something goes wrong. Take 2 minutes to learn more
Date: October 27, 2025
The Dogecoin market had rebounded off the support at the $0.1770 level nine sessions ago. However, price action hasn’t seen a rapid price growth following the rebound. The ongoing session has produced additional upside movement above key levels.
DOGE/USDT Long-Term Trend — Bullish (Daily Chart)
Key Price Levels:
Resistance: $0.2100, $0.2350, $0.2700
Support: $0.2000, $0.1800, $0.1600
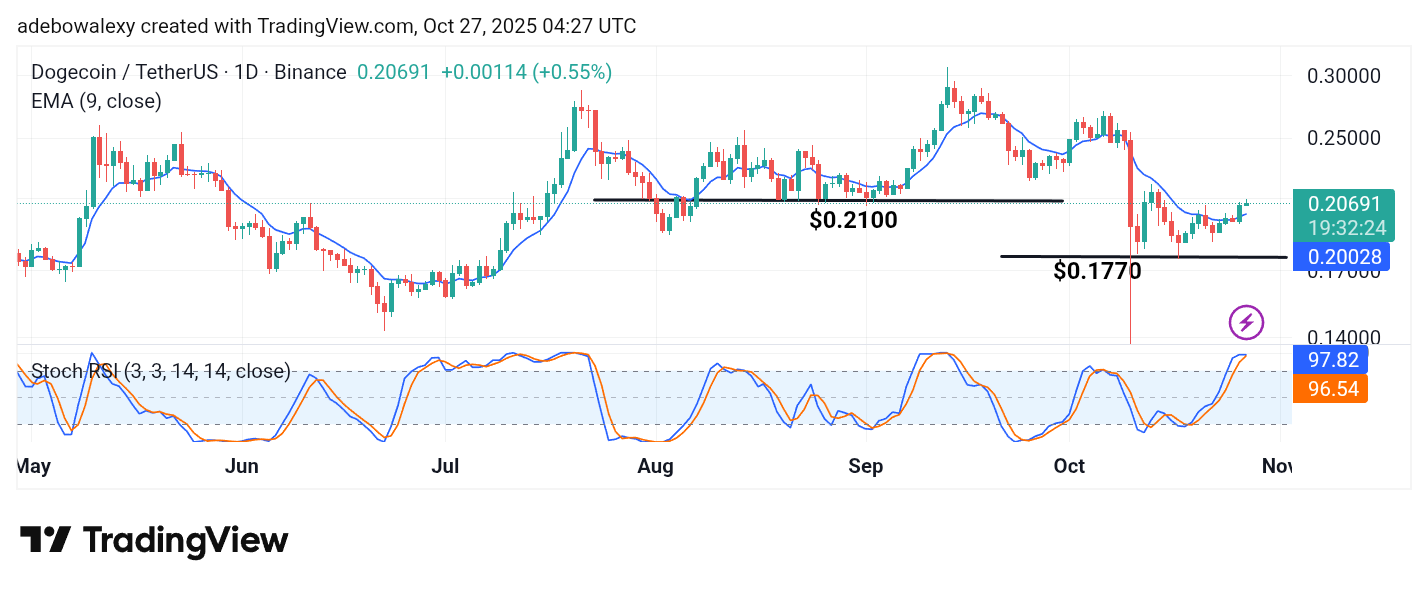
Though minimal, the ongoing session in the Dogecoin market appears somewhat bullish above the 9-day Exponential Moving Average (EMA) curve. However, it is worth noting that the mentioned price candle has an upper shadow as it stands above the EMA. Additionally, the Stochastic Relative Strength Index (SRSI) indicator lines can now be seen in the overbought zone of the indicator. Likewise, its lines are converged there at the 97 mark but maintain an upward trajectory.
Dogecoin (DOGE) Price Prediction: DOGE/USDT Stays Alive but Looks Limited
While indications still point to the possibility of seeing more upside movement in the Dogecoin daily market, it seems the bullish progress has very little room for growth now. The appearance of the last price candle on the chart above the 9-day EMA curve suggests that upside forces are strained at this point.
The Stochastic Relative Strength Index (SRSI) indicator curves are also in the overbought region and are converging but still maintain an upward bearing. As such, even if upside forces stay ahead, the market may not grow much given the strong overbought condition.
Dogecoin (DOGE) Price Prediction: DOGE/USDT Bulls Keep a Strained Countenance (4-Hour Chart)
Price activity on the Dogecoin 4-hour market can be seen looking strained above the 9-day EMA curve. The last price candle here is a tiny red one, and as such, signals that upside forces are finding it difficult to progress at this point.
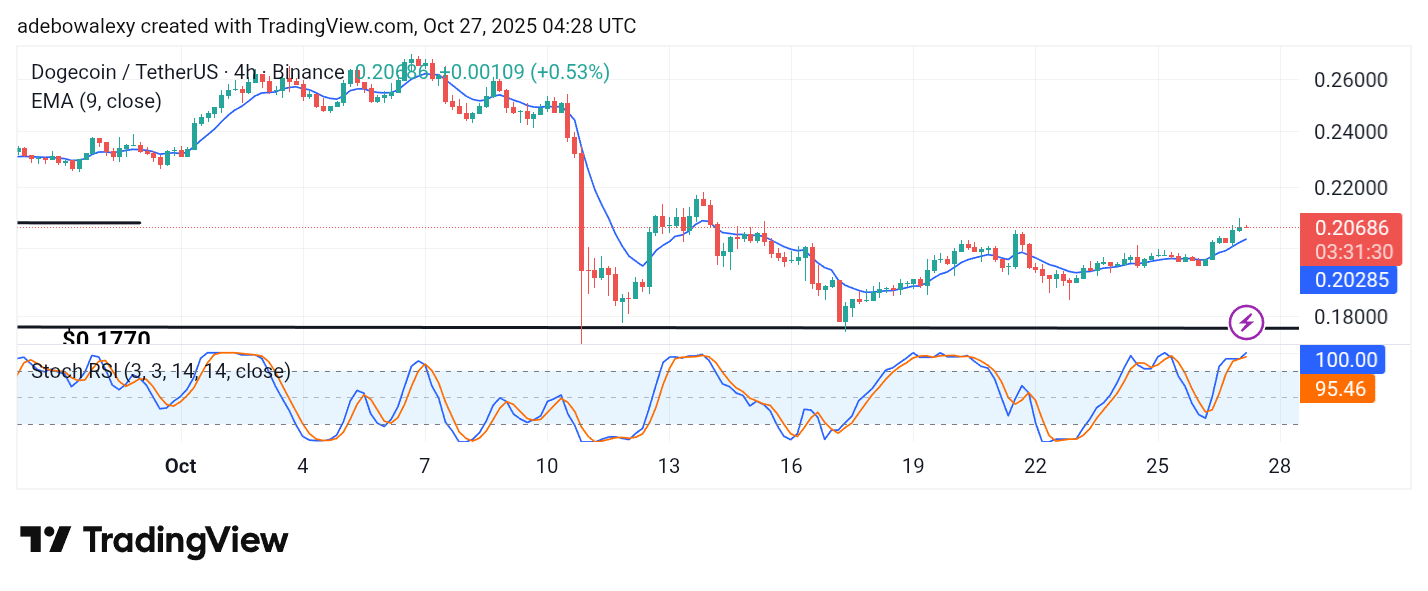
Nevertheless, the SRSI indicator recently delivered an upside crossover above the 80 mark of the indicator. The ensuing lines of the indicator maintain a convincing upward trajectory, even with the lead line already at the 100 mark. Therefore, it seems the upside forces may initiate a drag at technical limits, and this will likely yield only minimal gains, at least toward the $0.2120 price level..