Ethereum (ETH/USDT) Signals Shift Towards Resistance Amid Potential Pullback Risk
Estimated Reading Time: 4 minutes
Don’t invest unless you’re prepared to lose all the money you invest. This is a high-risk investment and you are unlikely to be protected if something goes wrong. Take 2 minutes to learn more
ETHUSDT Weekly Analysis: Bullish
In recent times, Ethereum against Tether has seen a strong bullish momentum. After a period of consolidation, ETH has surged higher, breaking out of key resistance levels.
The recent price action suggests that Ethereum is heading toward critical resistance points, potentially leading to further upward movement in the near term if momentum is sustained. However, the high Stochastic RSI indicates the market may be overbought, with the possibility of a short-term pullback before the next leg.
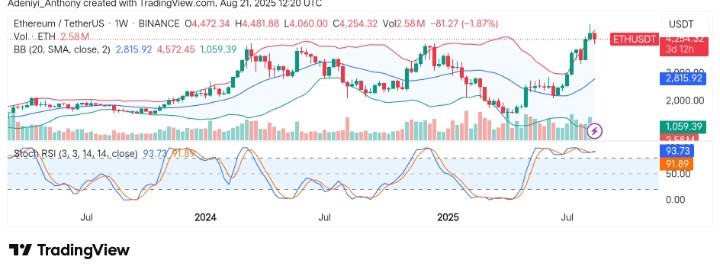
Currently, Ethereum trades at $4,254.32 with over 2.6 million traded volumes for the week.
Technical Indicators
Major Resistance Levels: $4,481.88, $4,500.00, and $5,000.00
Major Support Levels: $4,060.00, $3,850.00, and $3,250.00
Ethereum Technical Analysis
The analysis of Ethereum against Tether appears to be bullish based on structure. However, the pair seems overbought, as the price hangs around the upper band of the Bollinger Bands, suggesting the price might need to move slightly below before further upside movement if momentum is sustained.
Also, the Stochastic RSI beneath the chart appears to have reached an overbought condition (93.73) with a sharp divergence between the fast and slow lines. This signals that the market could be ripe for a correction in the short term. However, there has been an uptick in volume during the upward movement, suggesting strong participation in the current trend and that the current correction will be short-term.
To this end, the momentum is still bullish, but the price is approaching key resistance zones, suggesting a high probability of a pullback towards $3,250 or consolidation before the next upward move.
Ethereum Target Reached: Is $5,000 Next?
Overall, the market for Ethereum remains bullish, and a move to the upside is still in play. However, a pullback near $4,100 may materialize and a move toward $5,000 appears to be the next potential target.
At the moment, the support level looks like where the liquidity cluster is located. Though the pair seems to be losing momentum, it is wrong to assume that the price would fall below the immediate support level before a rally to the north.
ETH/USDT Analysis: A Look at Immediate Short-Term Momentum and Potential Reversal
On the daily timeframe, ETH/USDT is observed to be on continued bullish momentum, pushing the price towards the upper Bollinger Band. This signals the potential for a breakout if the price holds above key support levels.
As it stands, Ethereum is now near the upper Bollinger Band, it may face immediate resistance at the $4,292 level, followed by $4,395. However, if the price pulls back, key support zones lie around $4,139.93.
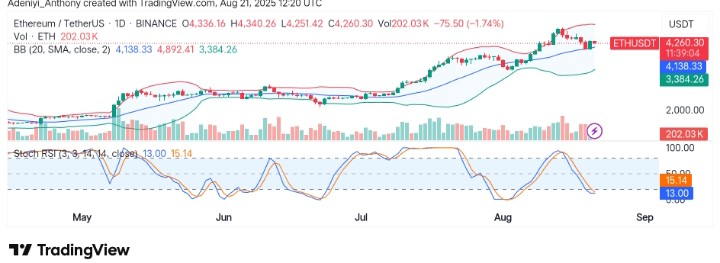
To this end, given the overbought conditions on the Stochastic RSI, a minor pullback towards the middle band might occur before continuing its upward movement.
Moreover, @cryptoking4ver in one of his tweet has posted that ETH may not move significantly for some time due to the amount of the token stucked in the exit queue.
Everyone is talking about $ETH withdrawals.
But here is what’s really happening:
Over $3.9B worth of ETH is stuck in the exit queue.
That means it cannot move right now.This shows strong staking confidence. pic.twitter.com/TIBcgzPNXK
— Crypto King (@CryptoKing4Ever) August 20, 2025
You can purchase crypto coins here. Buy Crypto