Litecoin (LTC) Price Prediction: LTC Consolidates Near the $81.00 Mark
Estimated Reading Time: 3 minutes
Don’t invest unless you’re prepared to lose all the money you invest. This is a high-risk investment and you are unlikely to be protected if something goes wrong. Take 2 minutes to learn more
Litecoin (LTC) Price Prediction, May 14
Litecoin’s price action has risen past the $80.00 mark. However, it appears that price movement is experiencing some challenges in advancing further upwards. As a result, the market has been largely consolidating below the $81.00 mark.
LTC/USDT Long-term Trend: Bearish (Daily Chart)
Key Levels
Resistance Levels: $85.00, $90.00, and $95.00
Support Levels: $80.00, $75.00, and $70.00
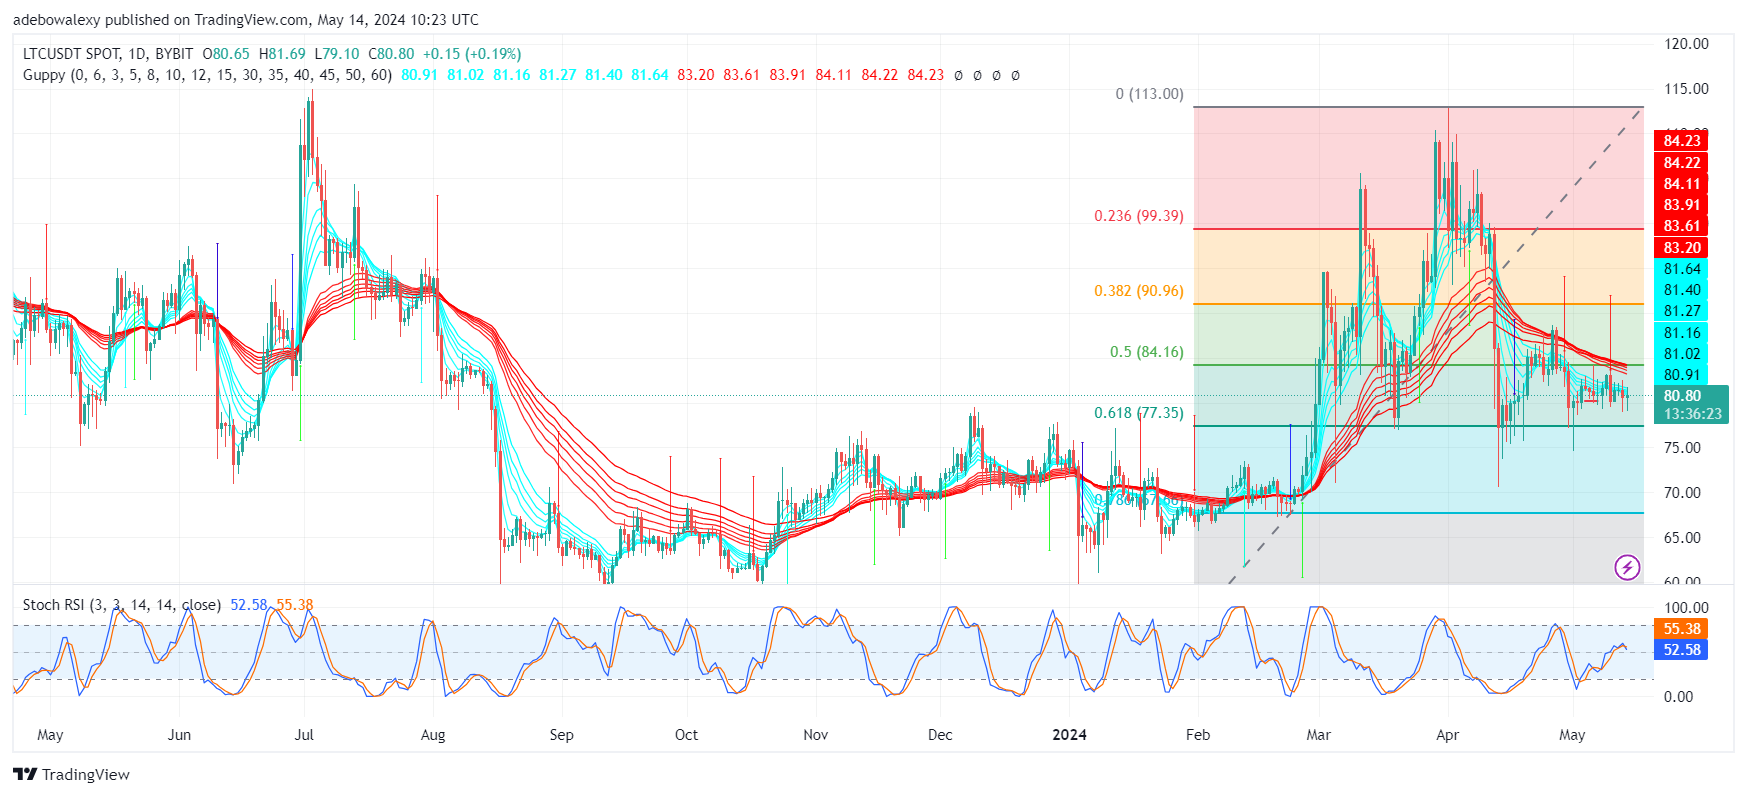
Daily Price Chart
On the daily chart, price action in the LTC market can be seen above the psychological price level of $80.00. Nevertheless, trading activities are still below the Guppy Multiple Moving Average (GMMA) lines. Meanwhile, the Stochastic Relative Strength (SRSI) indicator lines have just delivered a crossover, and the indicator lines have a bearish trajectory afterward.
Litecoin Price Prediction: What Can Be Possibly Anticipated in This Market?
With price action lying below the GMMA indicator lines, it can be deduced that headwinds are still of significant strength. Meanwhile, the last price candle corresponding to the ongoing session appears like a spinning top price candle, with a long upper and lower shadow. This reveals that market forces are at loggerheads. Be that as it may, the green color of the mentioned price candle suggests that upside forces are managing to stay in the lead.
However, the downward trajectory of the SRSI indicator lines suggests that downward forces may bounce back shortly to reclaim control of price movement. In fact, given that price action still lies below the GMMA lines, this holds strong promise for bears.
LTC/USDT Medium-term Trend: Litecoin May Extend Consolidation Move (4H Chart)
The LTC market has risen further upwards above the $80.00 mark to now trade above the $80.80 price level. The previous session moved the price of the token closer to the $81.00 threshold. But now, the current session has brought a minor bearish correction to that effect. At this point, the market has only surpassed one of the GMMA lines. Meanwhile, the SRSI indicator lines have just delivered a sideways-facing crossover.
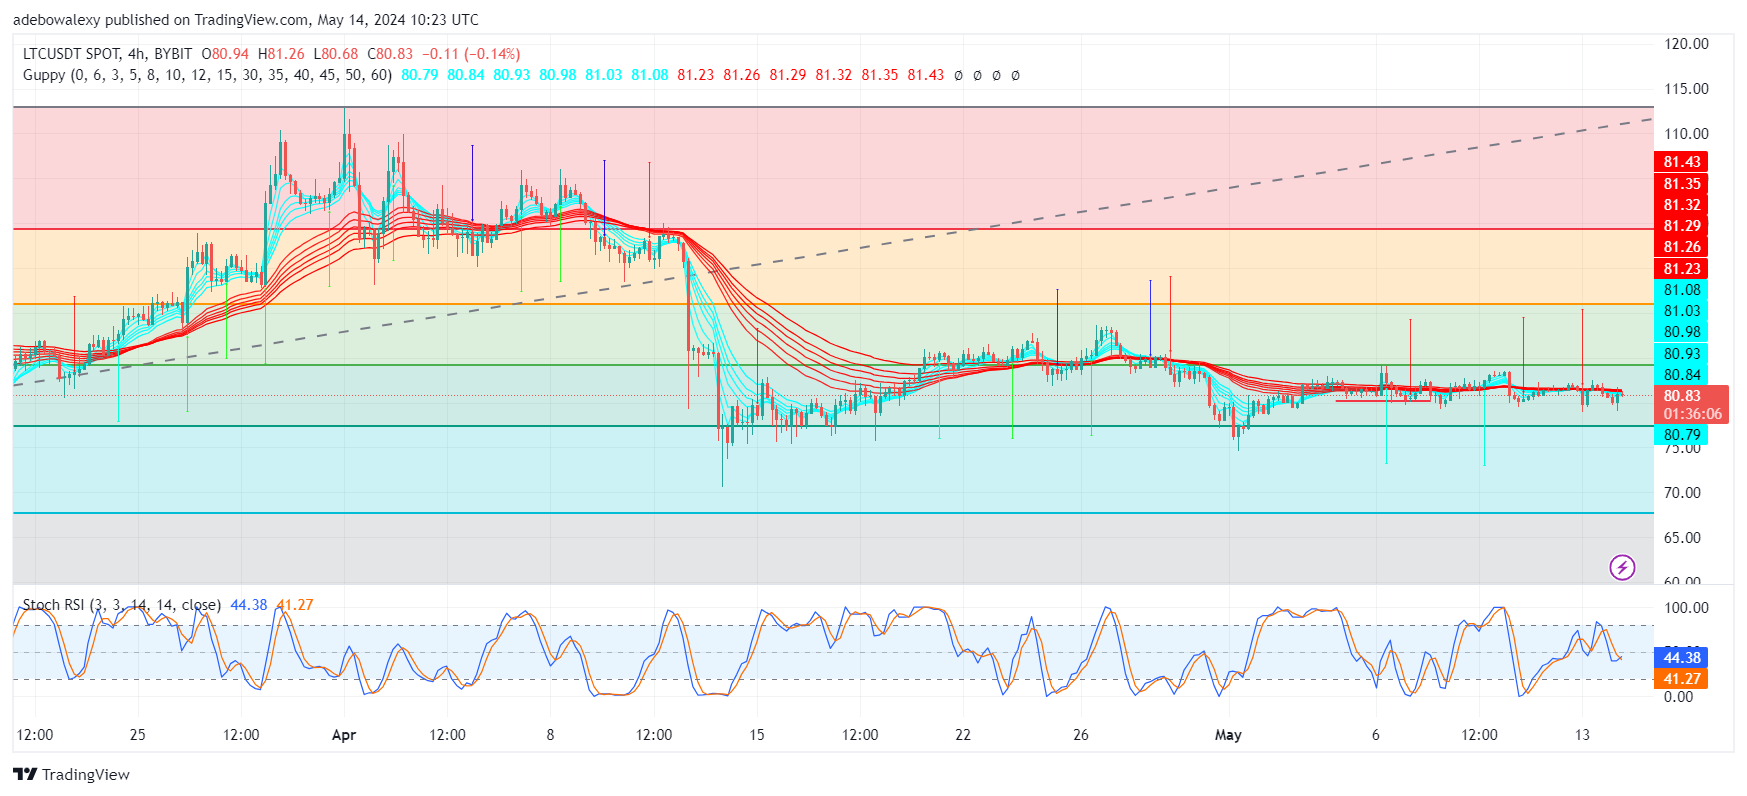
4-Hour Chart
Here it appears that price movement in this market is facing rejection already, while below the $81.00 mark. Also, the direction of the SRSI indicator lines isn’t offering much assurance that prices may go considerably bullish from this point on. Respecting the prevailing trend, traders may anticipate that prices may regress below the $80.00 mark soon.