Litecoin (LTC) Price Prediction: LTC/USDT Sees Minimal Rebound After Testing $80 Mark
Estimated Reading Time: 2 minutes
Don’t invest unless you’re prepared to lose all the money you invest. This is a high-risk investment and you are unlikely to be protected if something goes wrong. Take 2 minutes to learn more
Litecoin (LTC) Price Prediction: March 11
As Bitcoin falls below the $80,000 mark, other cryptocurrencies, including Litecoin, have been dragged along. However, at the time of writing, Litecoin has seen an upward contraction and a slight gain in the ongoing session.
LTC/USDT Long-Term Trend: Bearish (Daily Chart)
Key Price Levels
Resistance: $90.00, $100.00, $110.00
Support: $80.00, $70.00, $60.00
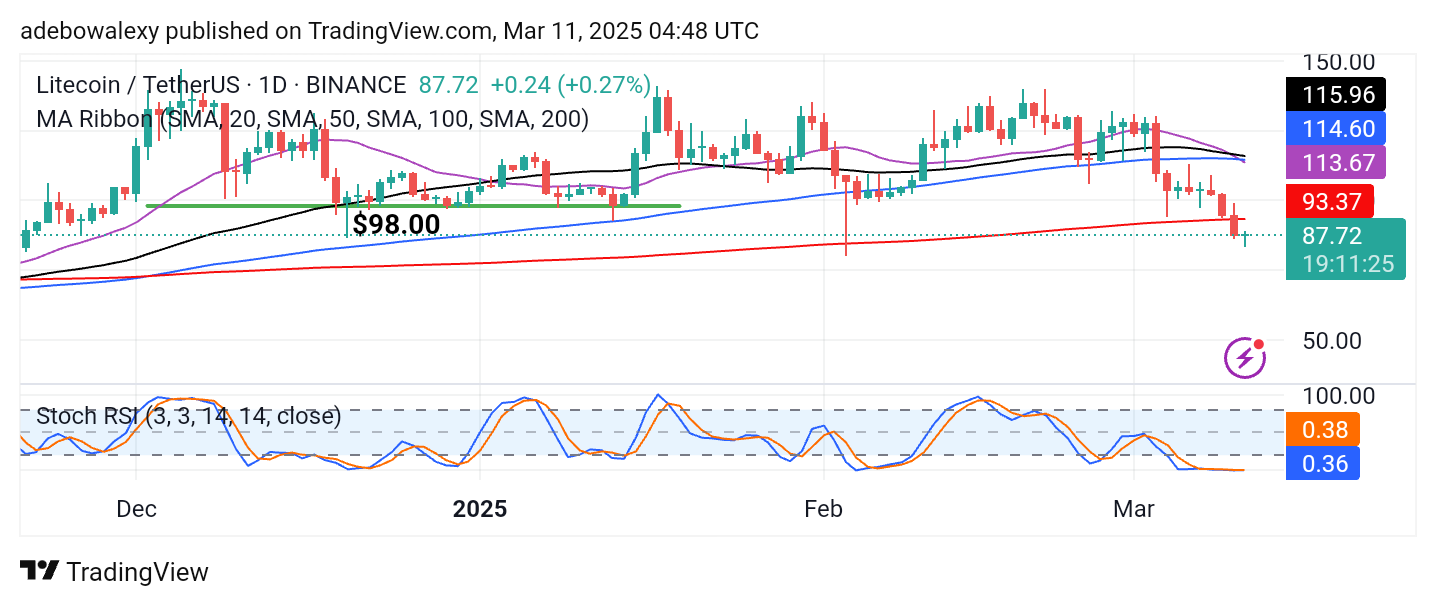
On the Litecoin daily chart, price action has fallen below all the Moving Average (MA) lines. No sooner had this occurred than the market witnessed an upward contraction, resulting in the appearance of a small green price candle in the ongoing session. Nevertheless, the Stochastic Relative Strength Index (RSI) lines still appear stagnant in the oversold region, indicating weak bullish momentum.
Litecoin (LTC) Price Prediction: LTC/USDT Bears Maintain a Threatening Presence
The ongoing session in the Litecoin market appears weakly bullish. Additionally, considering the position of the last price candle on the chart, downward pressure remains dominant.
This suggests that bullish momentum must significantly increase to overcome the resistance imposed by sellers. Meanwhile, the trajectory of the MA lines does not indicate much positivity, further suggesting the likelihood of continued downward retracement.
Litecoin (LTC) Price Prediction: LTC/USDT Bulls Struggle to Hold Above the $85.00 Mark (4-Hour Chart)
On the 4-hour chart, Litecoin’s price action has continued to move sideways above the $85.00 mark. The current session is represented by a green price candle, but price action remains below all the MA lines.
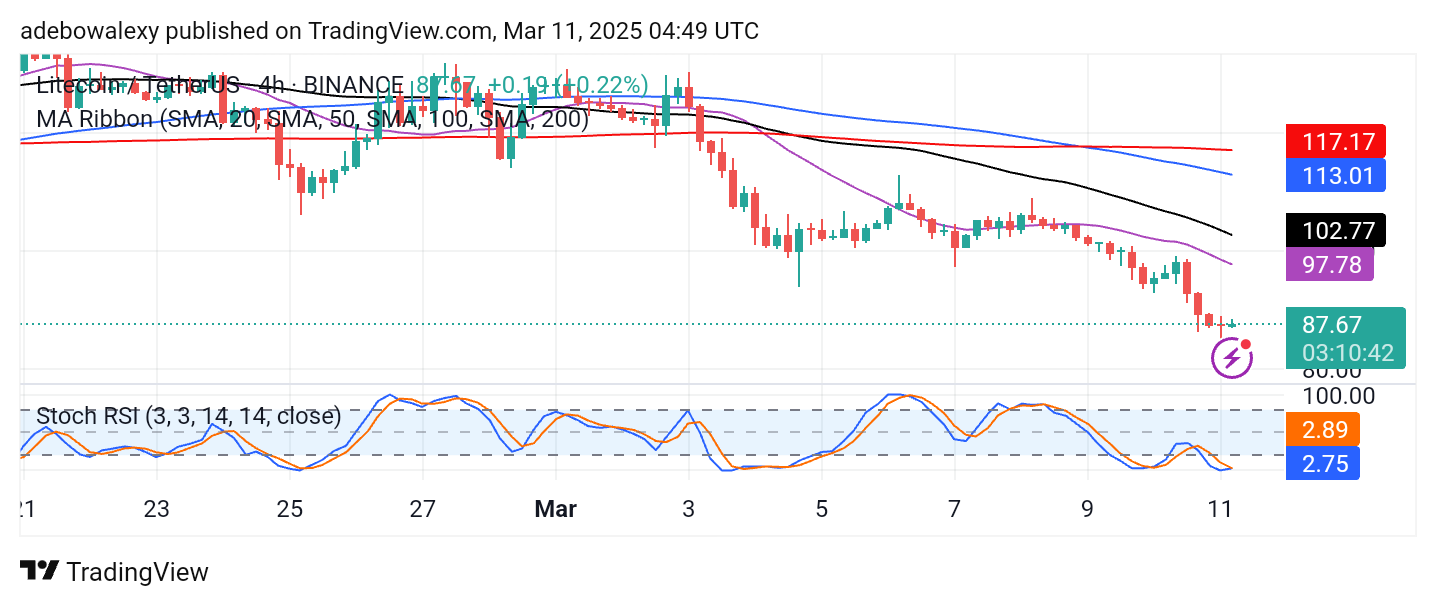
Meanwhile, the Stochastic RSI lines are in the oversold region and appear to converge for a crossover. Technically, this suggests a possible upside retracement. However, traders should be cautious and limit their targets below the $97.00 level, as the MA lines continue to present strong resistance above the current price action.