Litecoin (LTC) Price Prediction: LTC/USDT Tests a Technical Support
Estimated Reading Time: 3 minutes
Don’t invest unless you’re prepared to lose all the money you invest. This is a high-risk investment and you are unlikely to be protected if something goes wrong. Take 2 minutes to learn more

Litecoin (LTC) Price Prediction: September 10
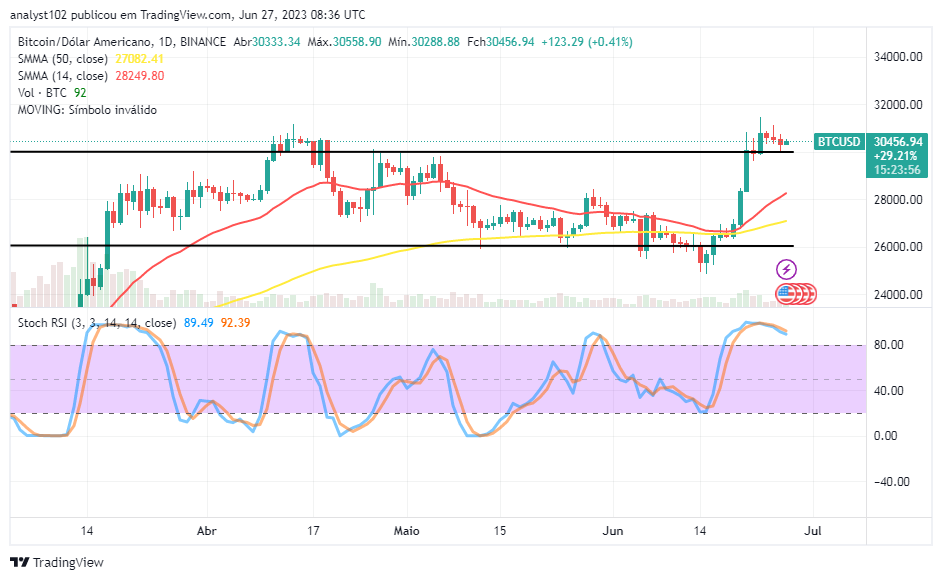
As long as Bitcoin continues to experience headwinds, most cryptocurrencies will likely face the same challenges. This can be seen in Bitcoin’s daily market performance, where price action is now testing a support level at the $61.00 mark.
LTC/USDT Long-term Trend: Bullish (Daily Chart)
Key Price Levels:
Resistance: $65.00, $70.00, $75.00
Support: $60.00, $55.00, $50.00
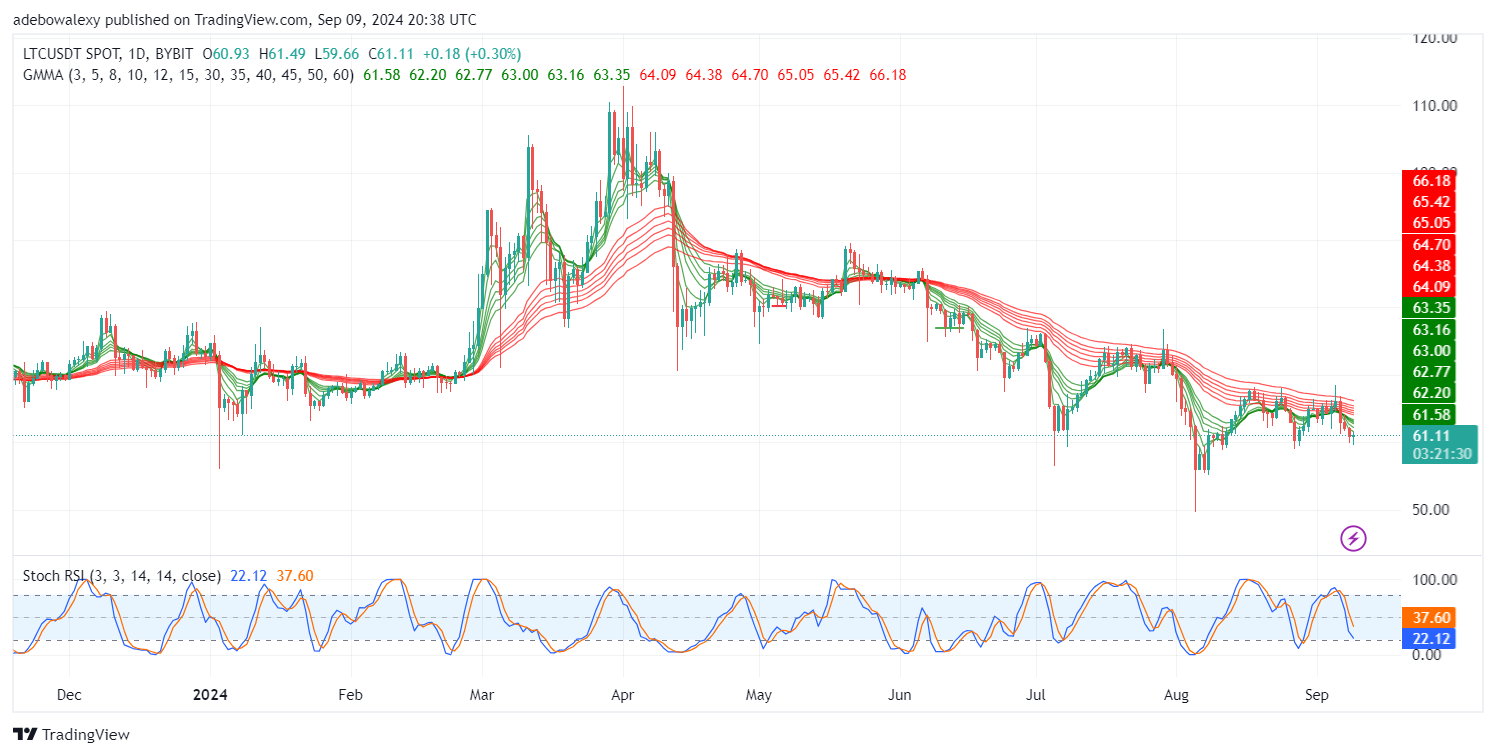
On the Litecoin daily chart, the latest price candle has appeared above the $61 price level. The lower shadow of the candle can be seen touching the mentioned psychological support level. Additionally, all the Guppy Multiple Moving Average (GMMA) lines are positioned above recent price activity. The Stochastic Relative Strength Index (Stochastic RSI) lines are also plunging into the oversold region.
Litecoin (LTC) Price Prediction: LTC/USDT May Break the $61.00 Support Level
The latest price candle on this Litecoin price chart has appeared green, indicating that upward forces are trying to preserve the support level. Nevertheless, the current price activity suggests that downward forces are more dominant.
This conclusion stems from the fact that the GMMA indicator lines are all above the price movement, signaling a downward trend. Additionally, the Stochastic RSI is still falling into the oversold region, aligning with the earlier bearish trend in the market.
Litecoin (LTC) Price Prediction: LTC/USDT Hits a Rejection at the $61.14 Mark (4-Hour Chart)
The LTC/USDT 4-hour market has rebounded upwards. However, the latest price candle on the chart reveals that the $61.14 level has presented a barrier to further upward progress. This has pushed the market below most of the green GMMA indicator lines. On the contrary, the Stochastic RSI lines are still projected upwards from the oversold region.
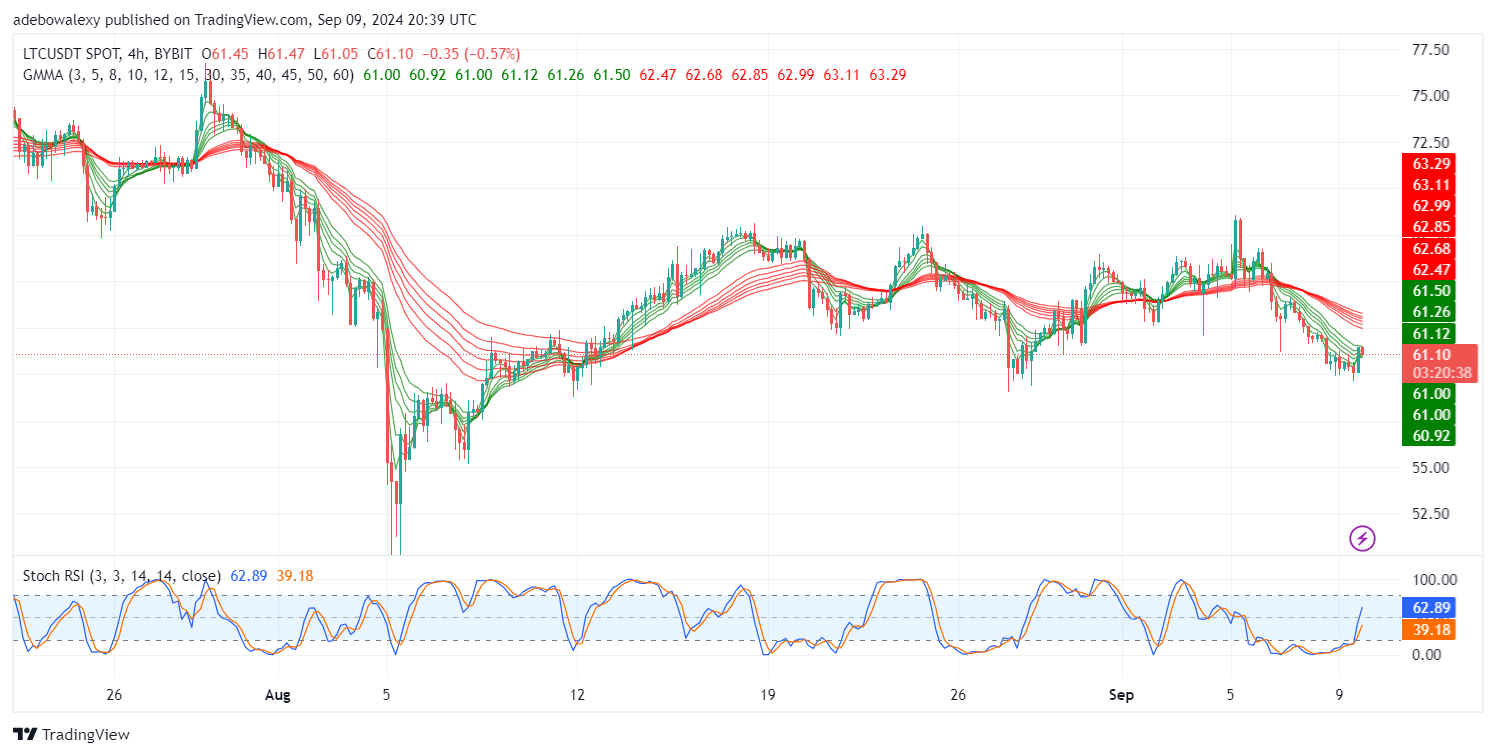
Based on the trend, this market seems more inclined toward lower price levels. The behavior of the Stochastic RSI may be reflecting past short-term bullish momentum. Nonetheless, bullish traders may have to wait and see if the market will bounce back above all the green GMMA lines. If that occurs, they can aim for higher price levels toward the $70.00 mark.