Lucky Block (LBLOCK) Price Analysis for October 18 – Positive Momentum Building
Estimated Reading Time: 3 minutes
Don’t invest unless you’re prepared to lose all the money you invest. This is a high-risk investment and you are unlikely to be protected if something goes wrong. Take 2 minutes to learn more

Lucky Block (LBLOCK) is displaying promising signs today, with a price increase of 2.60%, bringing it to $0.00002251. The charts suggest potential for continued growth as bullish forces begin to gain strength.
Daily Chart Analysis: Signs of a Bullish Breakout
The daily chart for Lucky Block paints an optimistic picture. Currently trading around $0.00002251, the token is nearing key resistance at $0.00002603. The Parabolic SAR shows encouraging signs, with dots below the price, signaling that the bulls are still in control. A breakthrough above $0.00002603 could trigger a stronger upward trend, pushing prices towards $0.00003000 and beyond.
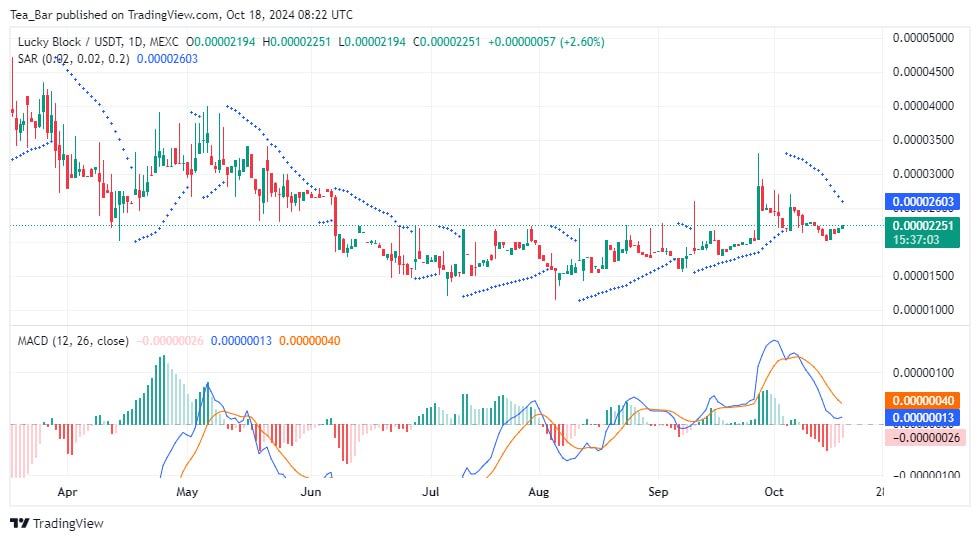
The MACD also points to positive momentum, as the MACD line hovers above the signal line, hinting at a potential for continued upward movement. If buying pressure increases, Lucky Block could experience a robust rally that breaks through key levels and sustains the bullish momentum.
4-Hour Chart Analysis: Ready for the Next Leg Up?
On the 4-hour chart, Lucky Block is consolidating around $0.00002251, showing signs of strength as the Parabolic SAR shifts below the price line, indicating a potential upswing. With support holding firm at $0.00002003, the stage is set for another bullish push.
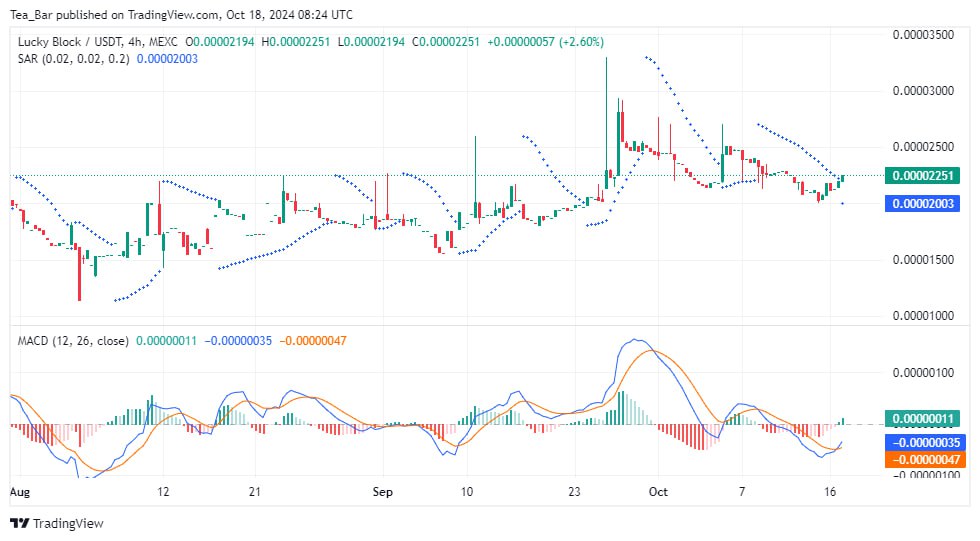
The MACD on this timeframe also reflects growing positivity, with the lines moving into bullish territory. The histogram suggests increasing momentum, hinting that a price surge could be around the corner. If Lucky Block manages to break above $0.00002550, we could see the token move toward the $0.00003000 mark in the short term, marking a significant victory for the bulls.
Conclusion
Lucky Block is showing strong potential for further gains as both the daily and 4-hour charts highlight bullish signals. With resistance at $0.00002550 and $0.00002603 within reach, a breakout could lead to significant price growth. Support at $0.00002003 is holding steady, giving bulls the upper hand in the near term. With momentum building, LBLOCK could soon enter a sustained upward trend, bringing exciting prospects for the token.
You can purchase Lucky Block here. Buy LBLOCK.