POL (ex-MATIC) Price Prediction: POL/USDT Falls Below the $0.4000 Threshold
Estimated Reading Time: 3 minutes
Don’t invest unless you’re prepared to lose all the money you invest. This is a high-risk investment and you are unlikely to be protected if something goes wrong. Take 2 minutes to learn more

POL (ex-MATIC) Price Prediction – February 1
The POL (ex-MATIC) token has eventually fallen below the $0.4000 threshold. Although the token now trades below this psychological price level, this isn’t an unusual occurrence, as price action has been fluctuating around this level in recent times.
POL/USDT Long-Term Trend: Bearish (Daily Chart)
Key Price Levels:
Resistance: $0.4000, $0.4500, $0.5000
Support: $0.3500, $0.3000, $0.2500
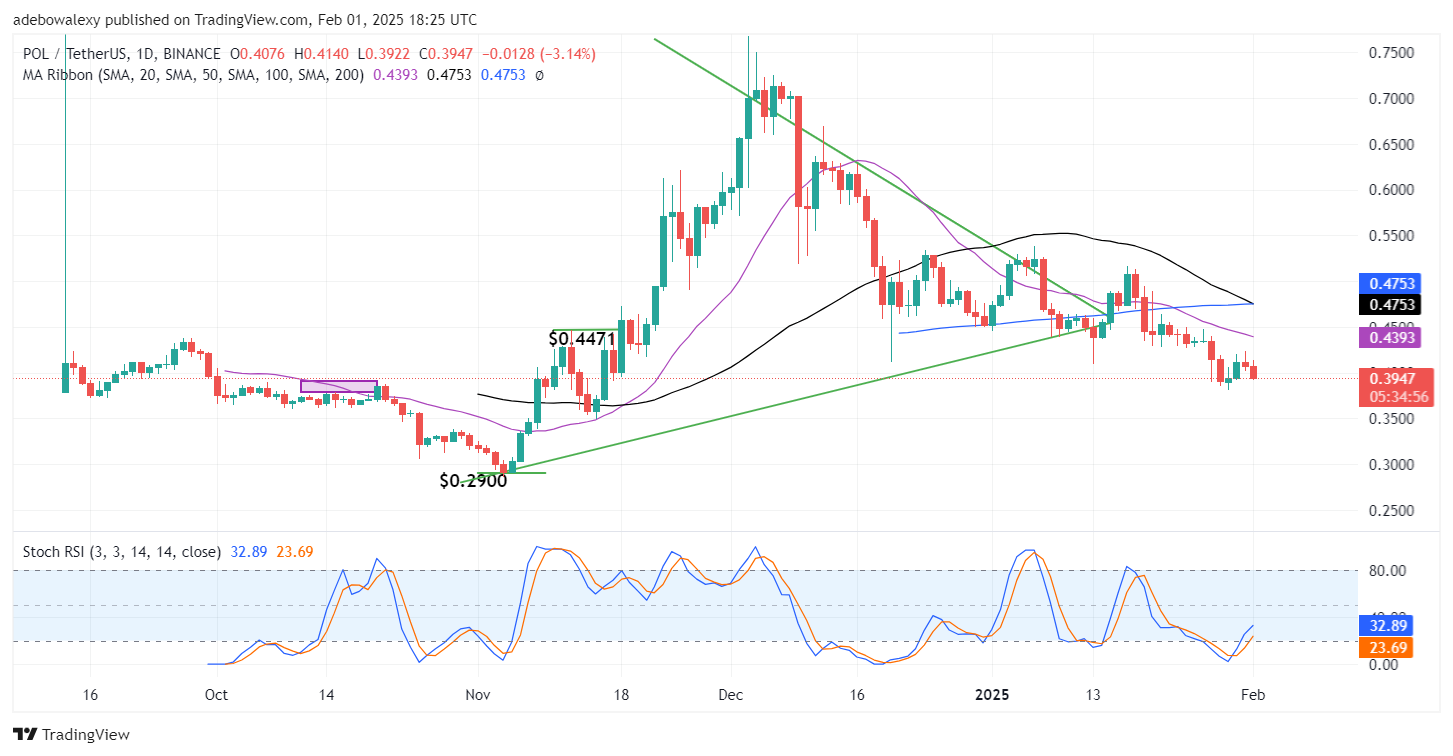
Price action in the POL (ex-MATIC) daily market turned bearish in the previous session after breaking below the $0.4000 threshold. The ongoing session continues downward, suggesting bearish momentum is strengthening. Additionally, the 50-day and 100-day Moving Average (MA) lines are converging for a bearish crossover above the price action. Meanwhile, despite this, the Stochastic Relative Strength Index (RSI) indicator is still maintaining an upward trajectory, indicating some bullish resistance.
POL (ex-MATIC) Price Prediction: Headwinds Threaten Further Price Declines
The POL (ex-MATIC) token continues to hover around the $0.4000 price level. However, indicators suggest a potential further decline.
For instance, price activity on the daily chart lies below all the Moving Average (MA) curves, signaling sustained bearish pressure. Additionally, the 50-day and 100-day MA lines are converging for a crossover above price action, reinforcing the bearish sentiment.
On the other hand, the Stochastic RSI lines are still trending upward, likely due to recent price increases in the past two sessions. However, traders should consider the possibility that downward forces may strengthen further.
POL (ex-MATIC) Price Prediction: POL Stays Above $0.3930 (4-Hour Chart)
Price action in the POL (ex-MATIC) 4-hour market is hovering just above the $0.3930 price level. However, the ongoing session is witnessing reduced bearish momentum, as indicated by the size of the last price candle on the chart. Additionally, the market has fallen below all MA lines, while the RSI indicator lines are deep in the oversold region, signaling potential market exhaustion.
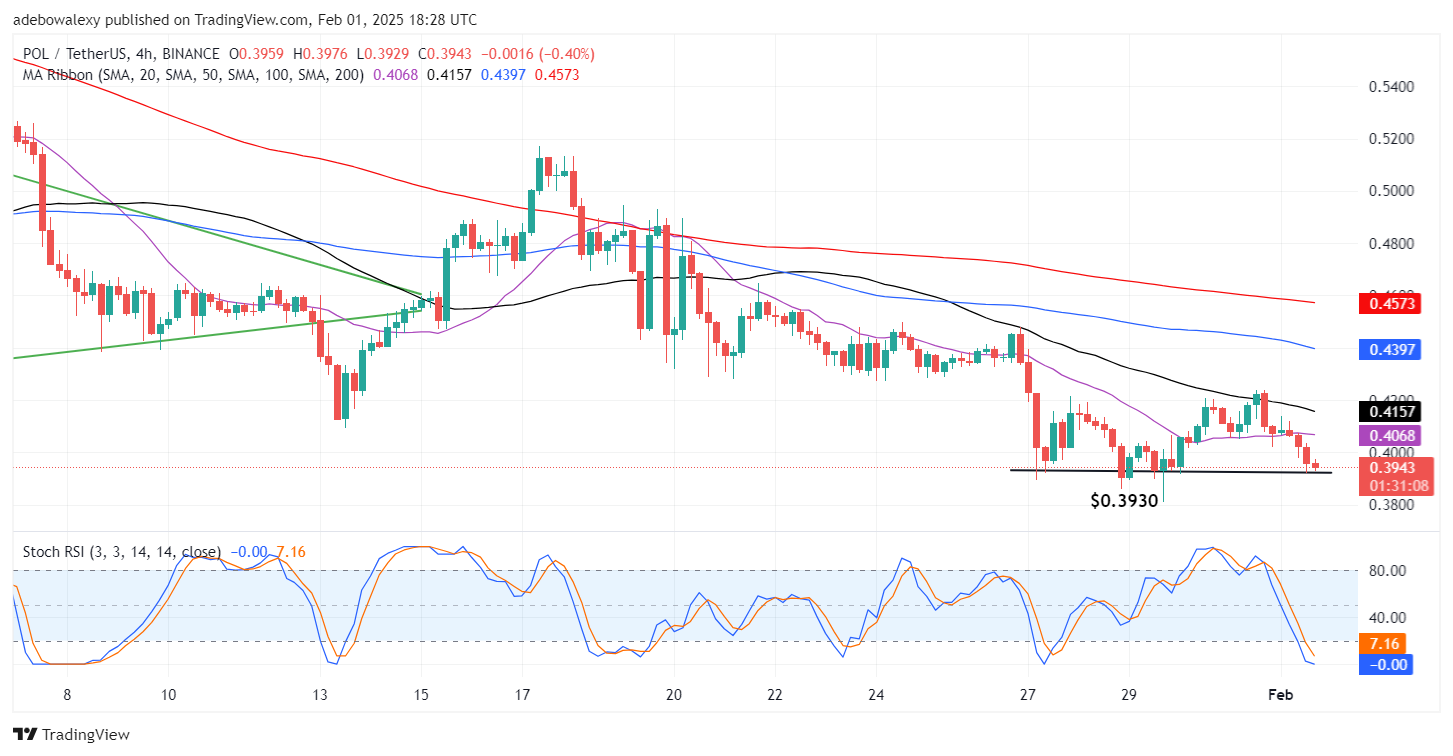
The 4-hour chart reveals ongoing market activity. The current session suggests that bears remain in control but with weakening momentum. However, the Stochastic RSI lines maintain a downward trajectory, indicating that downward forces still dominate price movement. Given these conditions, traders can still target the $0.3500 price level as a potential support zone.