POL (prev. MATIC) Price Prediction: POL/USDT Isn’t Making Much Progress
Estimated Reading Time: 3 minutes
Don’t invest unless you’re prepared to lose all the money you invest. This is a high-risk investment and you are unlikely to be protected if something goes wrong. Take 2 minutes to learn more

Date: October 25, 2025
Since the last heavy price crash in the POL (prev. MATIC) market, one can see that price activity hasn’t been able to pick itself up notably. The ongoing session suggests that upside forces are still subdued and may find it an uphill task to achieve much progress subsequently.
POL/USDT Long-Term Trend — Bearish (Daily Chart)
Key Price Levels:
Resistance: $0.2000, $0.2500, $0.2750
Support: $0.1900, $0.1750, $0.1500
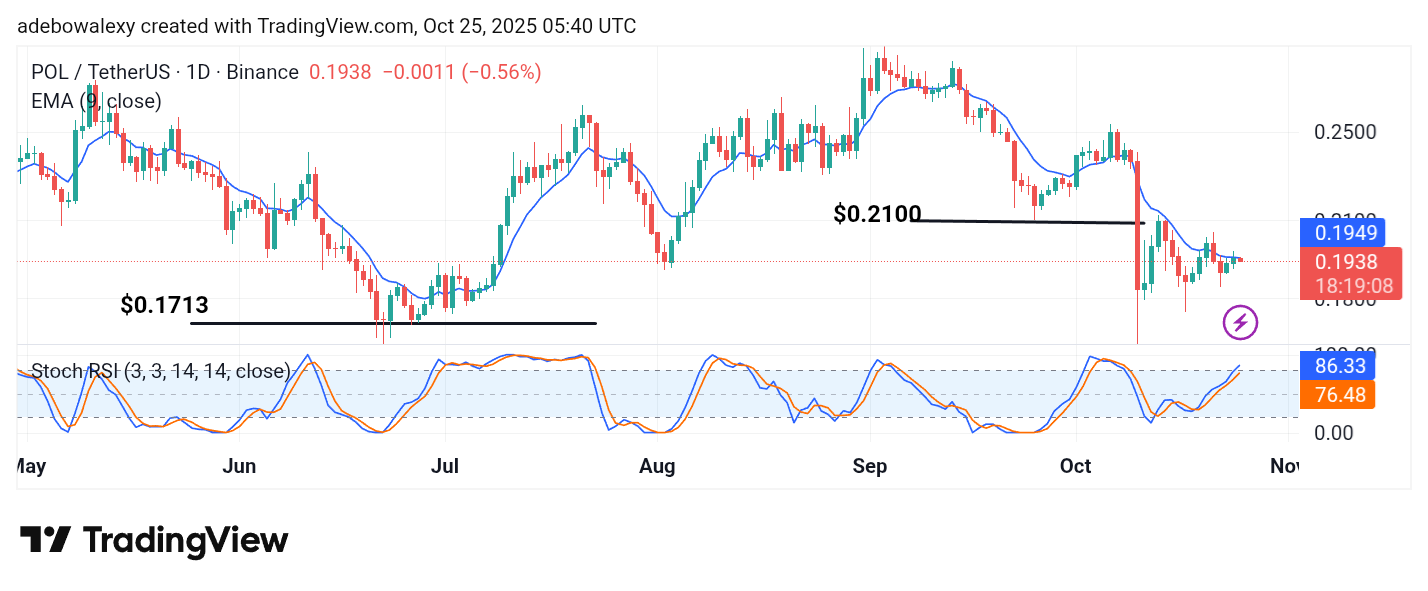
The POL (prev. MATIC) market has continued to trade below the 9-day Exponential Moving Average (EMA) line. The ongoing session here is represented by a red price candle. Meanwhile, the Stochastic Relative Strength Index (SRSI) indicator lines have kept to their upward trajectory and are now in the overbought region of the indicator. However, the movement of the SRSI indicator seems largely due to the modest gains in the past two sessions.
POL/USDT Price Prediction: POL (prev. MATIC) Lies Under Crushing Weight
The POL (prev. MATIC) market has been on the sluggish side on the daily chart. Even the current session has denied the token any further modest price increases. This could be seen as price movement that bounces off the 9-day EMA curve.
At the same time, the SRSI indicator lines can be observed to have risen high into the overbought region of the indicator. This is so despite the instantaneous pullback in the current session. Furthermore, the movement of the SRSI indicator lines appears exaggerated and, as such, suggests that downward forces are weak.
POL/USDT Price Prediction: POL (prev. MATIC) Bulls Get Forced to a Base Level (4-Hour Chart)
Here on the POL (prev. MATIC) 4-hour market, price movement has risen past the 9-day EMA curve. Likewise, the ongoing session is still hugging the base level at the 9-day EMA line.

Furthermore, the ongoing session stays consistent with the fact that downward forces are still acting. This can be seen via the heavily compressed look of the 9-day EMA lines. The SRSI lines are in the overbought region of the indicator and, as such, hint that downward forces have been successful. Therefore, bears may anticipate a bearish retracement toward the $0.1900 price level.