Polkadot (DOT/USDT) Eyes Potential Breakout Amid Consolidation
Estimated Reading Time: 3 minutes
Don’t invest unless you’re prepared to lose all the money you invest. This is a high-risk investment and you are unlikely to be protected if something goes wrong. Take 2 minutes to learn more
Polkadot Mid-term Analysis: Ranging
Polkadot against Tether has ranged within a narrowing region for a while. Recently, price action has held steady near a key support, suggesting a potential breakout.
In the meantime, a combination of indicators points to an imminent shift in market dynamics. With potential upside movement towards the upper resistance as the weekly volumes increase.
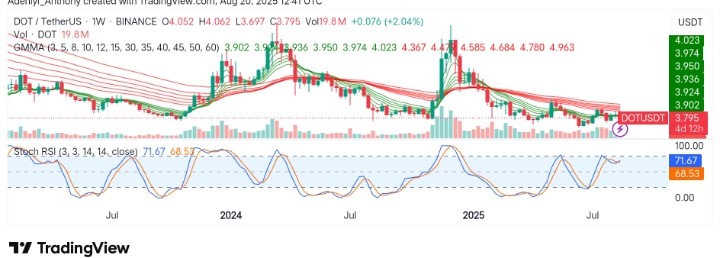
Currently, Polkadot trades at $3.795 with over 19 million traded volumes for the week.
Technical Indicators
Major Resistance Levels: $4.020, $4.370, and $4.580
Major Support Levels: $3.750, $3.530, and $3.390
Polkadot Technical Analysis
On the weekly timeframe, Polkadot against Tether appears to be making a move to the north amid a tight region of the Guppy Multiple Moving Averages (GMMA). However, the short-period EMAs are still positioned under the long-period EMAs, suggesting that the bears are still in control, but the convergence of the lines signals that a breakout is near.
Meanwhile, the Stochastic RSI beneath the chart shows the pair has a lot of potential to the north, as the indicator’s lines show momentum is building towards $4.020 despite previous price actions.
As it stands, if the price can be the immediate resistance level, which is $4.020, with an increasing volume, a breakout to the north is certain. Conversely, a prolonged move at the current level with an attempt to pull back below could lead to further correction.
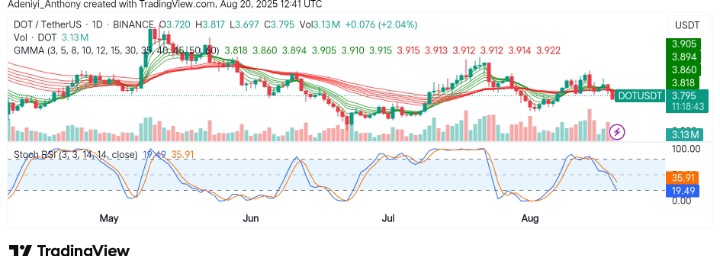
DOT/USDT Daily Analysis: Testing Support for Upside Movement
The DOT/USDT on the daily timeframe appears to be displaying a crucial setup specifically around the $3.800 level. The price appears to be testing immediate support for a bullish reversal. However, the GMMA setup shows the market is still controlled by the bear, while the Stochastic RSI signals oversold condition.
Additionally, the volume indicators suggest participation is relatively low for bullish reversal as the price continues to oscillate between $3.810 and $3.910.
However, amidst this range-bound activity, Polkadot announces the launching of PolkadotCG to bridge the gap between traditional financial systems and the Web3 ecosystem. To this end, if this new update is properly done, the ecosystem may record more institutional participations.
ICYMI: @Polkadot is going institutional 🏛️
The $DOT network has launched @PolkadotCG, a new arm focused on bridging TradFi with Web3 — targeting asset managers, banks, exchanges and VCs pic.twitter.com/UCSlYMjupQ
— crypto.news (@cryptodotnews) August 19, 2025
You can purchase crypto coins here. Buy Crypto