Polygon (ex-MATIC) Price Prediction: POL/USDT Price Surges Past the $0.5000 Threshold
Estimated Reading Time: 3 minutes
Don’t invest unless you’re prepared to lose all the money you invest. This is a high-risk investment and you are unlikely to be protected if something goes wrong. Take 2 minutes to learn more

POL Price Prediction for November 23
The Polygon (ex-MATIC) coin resumed its upward path two sessions ago. The market has maintained the same trajectory in subsequent sessions until now. Also, by closely examining the market, it seems like price action has continued to gain increasing bullish momentum.
POL/USDT Long-Term Trend: Bullish (Daily Chart)
Key Price Levels:
Resistance: $0.5500, $0.6000, $0.6500
Support: $0.5000, $0.4500, $0.4000
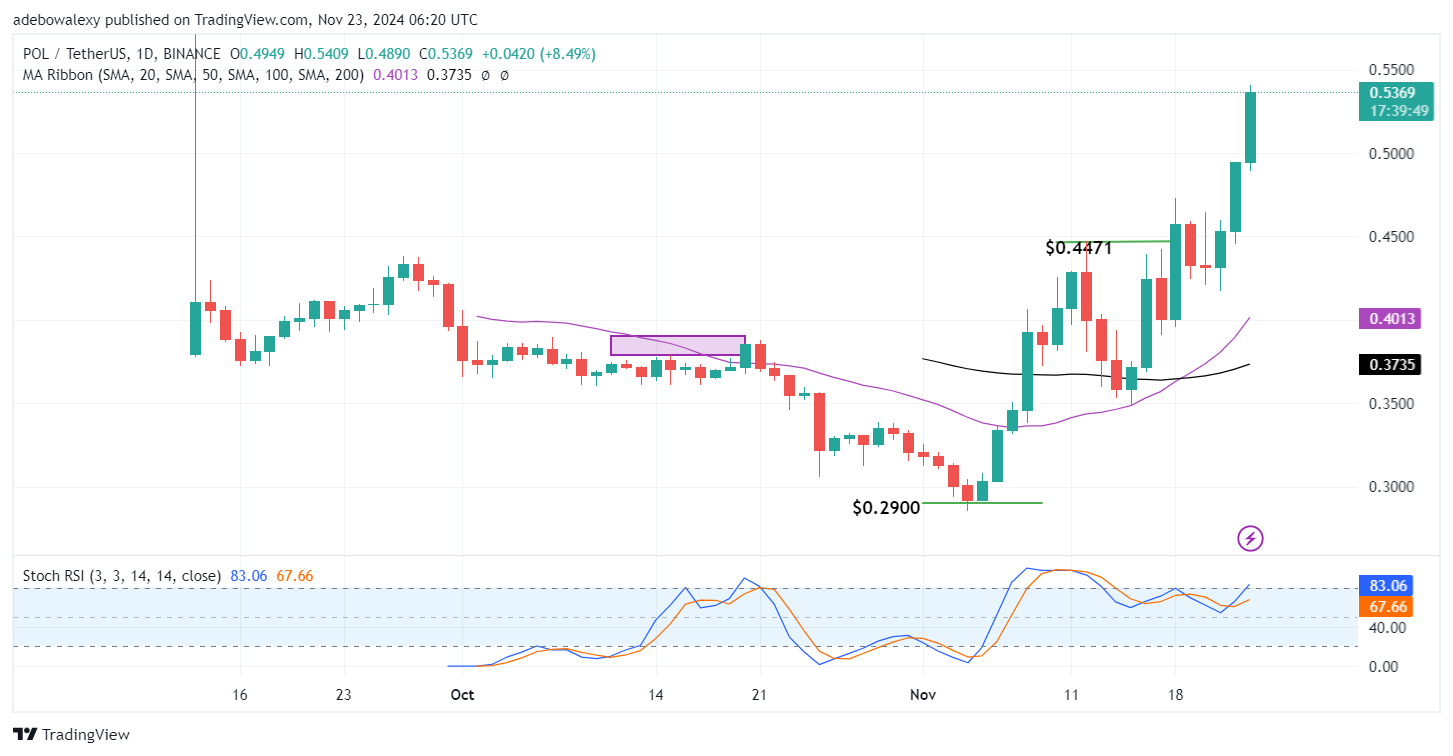
Price action, as stated above, recently regained bullishness. The market has maintained the trend for the third consecutive session now. Currently, the last price candle can be seen placing the market above the $0.5000 mark and near the $0.5500 mark as resistance. Consequently, trading activities in this market are now at a significant distance above all the Moving Average (MA) lines. Also, the applied Stochastic Relative Strength Index lines can be seen rising steadily upward following a bullish crossover not too far above the 50 mark of the indicator.
Polygon (ex-MATIC) Price Prediction: POL/USDT Begins a Bullish Cycle
The Polygon (ex-MATIC) coin has been observed in recent times to be making higher lows. This started ever since the market rebounded off the support at the $0.2900 threshold. This market has continued upward with few retracements along the way. Currently, price action has risen high above the 20- and 50-day MA lines. Even the last price candle still stands green with a large body size, which portrays the strength of buying in the market.
In addition, the Stochastic RSI indicator has aligned to confirm the ongoing trend in the market. The lines of the indicator are proceeding upward following a crossover just above the 50 mark of the indicator. Technically, it appears that the overall upward trend will likely continue.
Polygon (ex-MATIC) Price Prediction: POL/USDT Bulls Are Standing Strong (4-Hour Chart)
Bullish activity is generating a strong outlook even in the Polygon 4-hour market. Price activity has stayed in the green consistently for the past three sessions. Likewise, the ongoing session is extending that trend as it stands green, placing the current price of this token above all the MA curves. The Stochastic RSI lines are still in the overbought region, with the leading line already dragging sideways at the 100 mark of the indicator. The lagging line of this indicator is tagging along as it approaches the 100 mark.
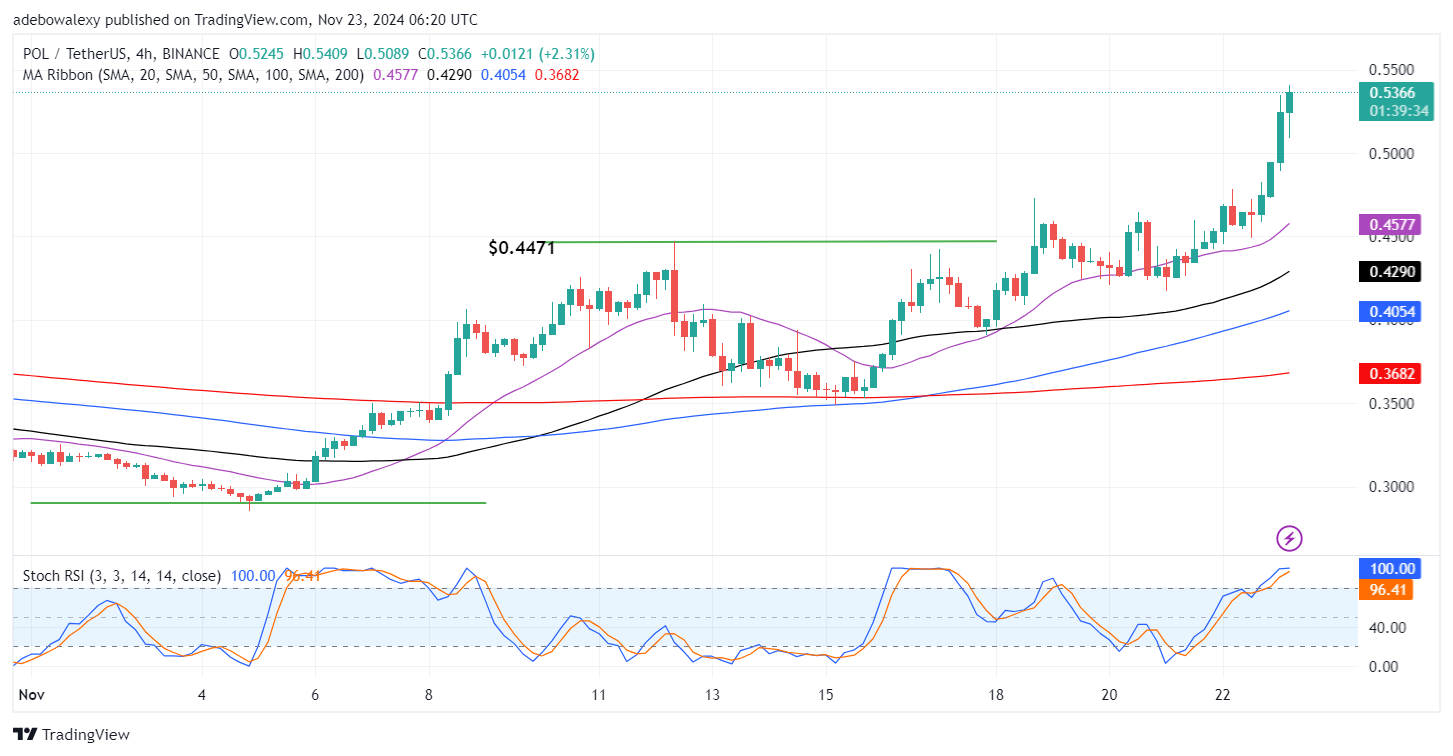
Going by technical indications, it appears that the market may still progress upwards. The position of recent price action above all the MA lines gives upside forces the edge in this market. Also, the behavior of the Stochastic RSI lines suggests that the market may approach higher price marks. The dragging of the indicator’s lead line suggests that upside forces are ready to keep pushing. This may see the market through the $0.5500 price level soon and towards the $0.6000 in subsequent sessions.