Polygon (ex-MATIC) Price Prediction: POL/USDT Sees a Bullish Rebound Off the $0.2900 Mark
Estimated Reading Time: 3 minutes
Don’t invest unless you’re prepared to lose all the money you invest. This is a high-risk investment and you are unlikely to be protected if something goes wrong. Take 2 minutes to learn more

Polygon (ex-MATIC) Price Prediction for November 9
The Polygon market witnessed a strong bullish rebound after its price action tested the support at the $0.2900 mark. This seems to have coincided with the US presidential election result, as the market began witnessing strong tailwinds following the result announcement. While the market faces rejection, the overall trend may still be bullish.
POL/USDT Long-Term Trend: Bullish (Daily Chart)
Key Price Levels:
Resistance: $0.4000, $0.5000, $0.6000
Support: $0.3500, $0.3000, $0.2500
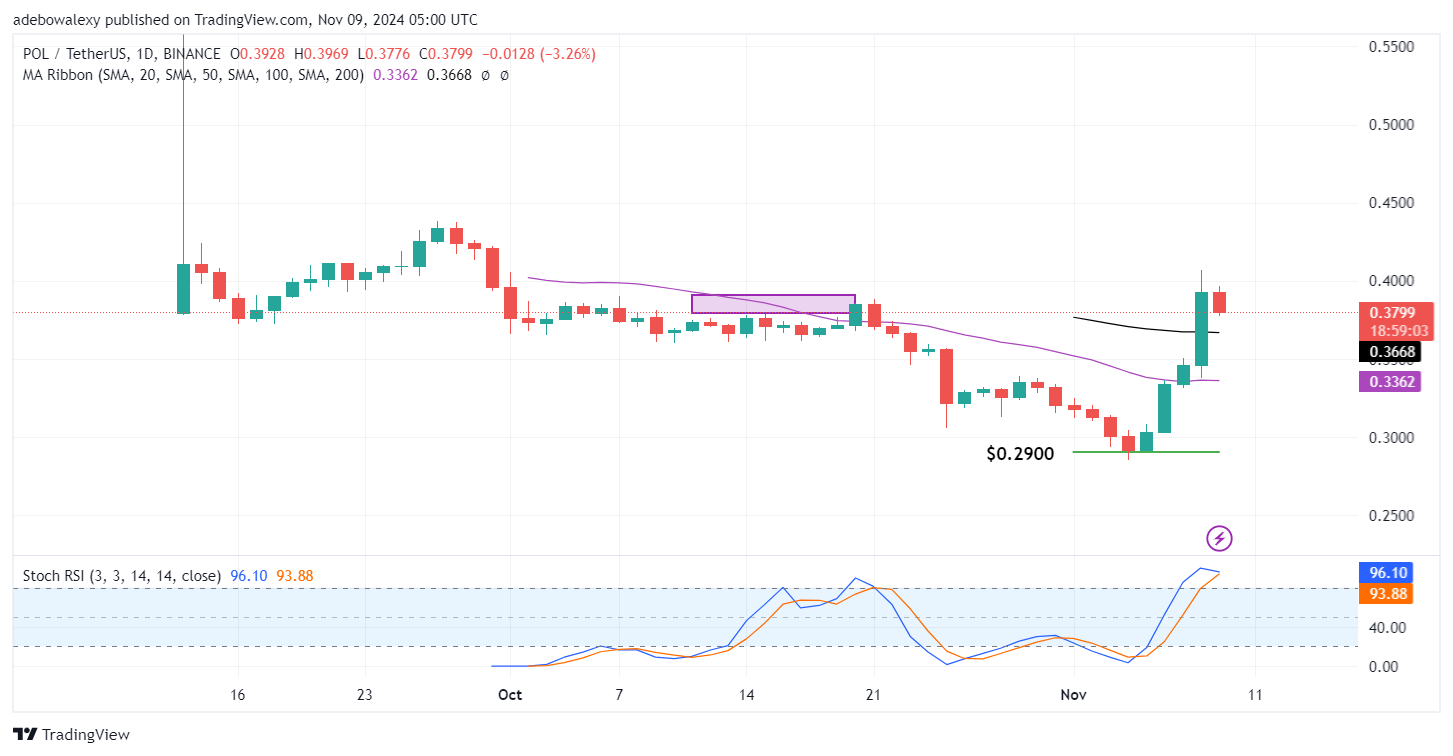
The recent upside retracement in the Polygon (ex-MATIC) daily market faced a strong barrier at the $0.4000 resistance level. As a result, the following session saw a moderate downward correction. Yet, the current price of the token remains above the 20-day and 50-day Moving Average (MA) lines on the chart. At the same time, the Stochastic RSI lines have started converging for a potential crossover in the overbought region.
Polygon (ex-MATIC) Price Prediction: POL/USDT Bulls Appear Shielded
Although the ongoing session in the ongoing Polygon market has resulted in a moderate downward correction, the current price of the token remains above important technical thresholds. The current session has brought the market below the $0.4000 price level. However, the latest price candle is still above all the MA lines.
Additionally, the Stochastic RSI lines are above the 80 mark, indicating an overbought condition. Nevertheless, upward momentum seems to be facing some challenges. The indicator lines have yet to deliver a crossover, suggesting potential bearish activity. Traders may hope for an upward rebound off the 50-day MA line if the upside correction continues.
Polygon (ex-MATIC) Price Prediction: Hopes of Upside Retracement Stay Alive in the POL/USDT Market (4-Hour Chart)
The downward correction in the Polygon (ex-MATIC) has continued for three sessions. However, the current session has shown signs of decreasing bearish momentum. The price action remains significantly above the MA lines on this 4-hour chart. The 20-day and 200-day MA lines are converging for a potential bullish crossover below the price action. Meanwhile, the Stochastic RSI lines are still descending rapidly into the oversold region.
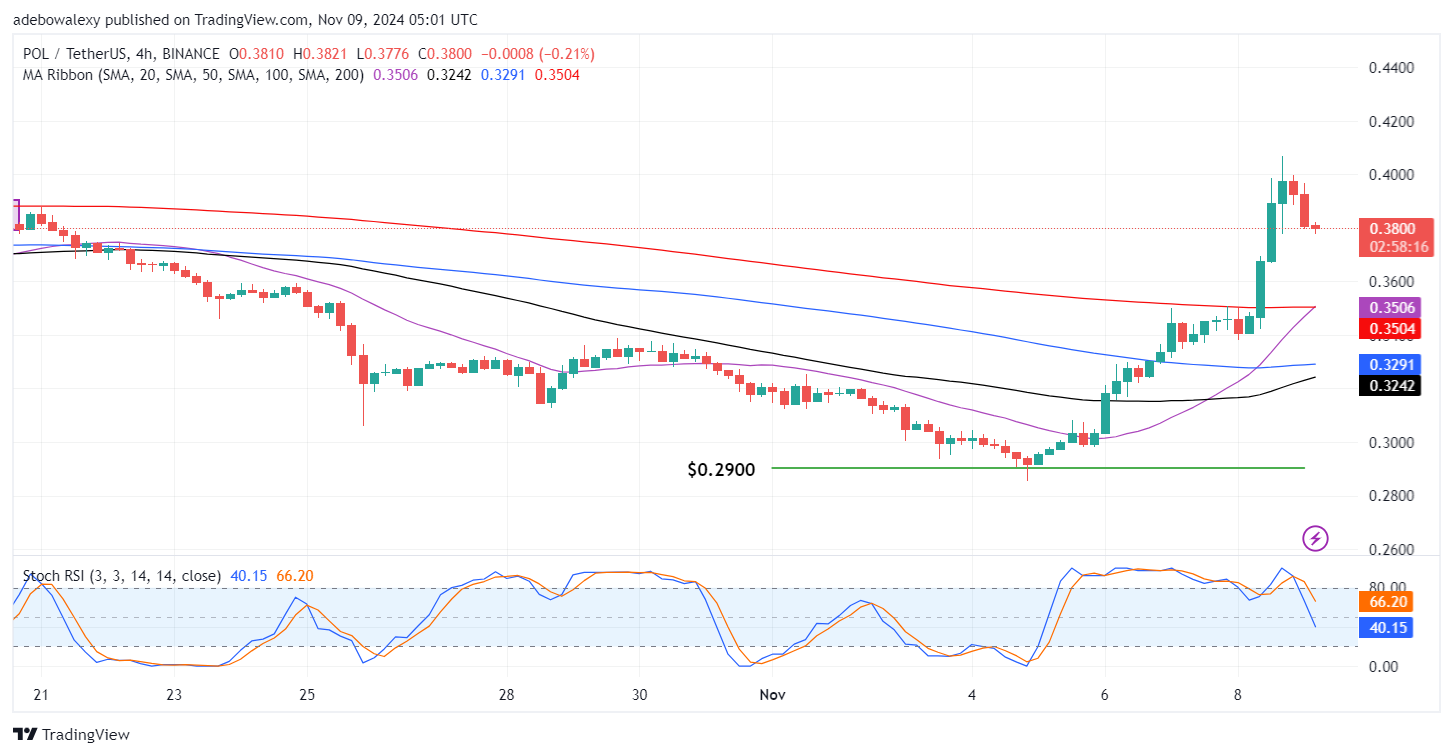
Technically, indicators suggest that downward pressure is weakening. The smaller size of the latest price candle indicates decreasing bearish momentum, especially above the converging MA lines. The exaggerated movement of the Stochastic RSI also hints that bears may be losing steam. Consequently, traders may anticipate an upward rebound towards the $0.4000 mark shortly.