Solana Price Prediction: SOL/USDT Rejected at the $180 Price Level
Estimated Reading Time: 3 minutes
Don’t invest unless you’re prepared to lose all the money you invest. This is a high-risk investment and you are unlikely to be protected if something goes wrong. Take 2 minutes to learn more
Solana Price Prediction for November 1
The Solana market has been trending upward recently. However, it faced strong resistance at the psychological $180 price level. Currently, the last price candle stands at a crucial level, which appears important for determining future price direction.
SOL/USDT Long-term Trend: Bearish (Daily Chart)
Key Price Levels:
Resistance: $180, $190, $195
Support: $175, $170, $165
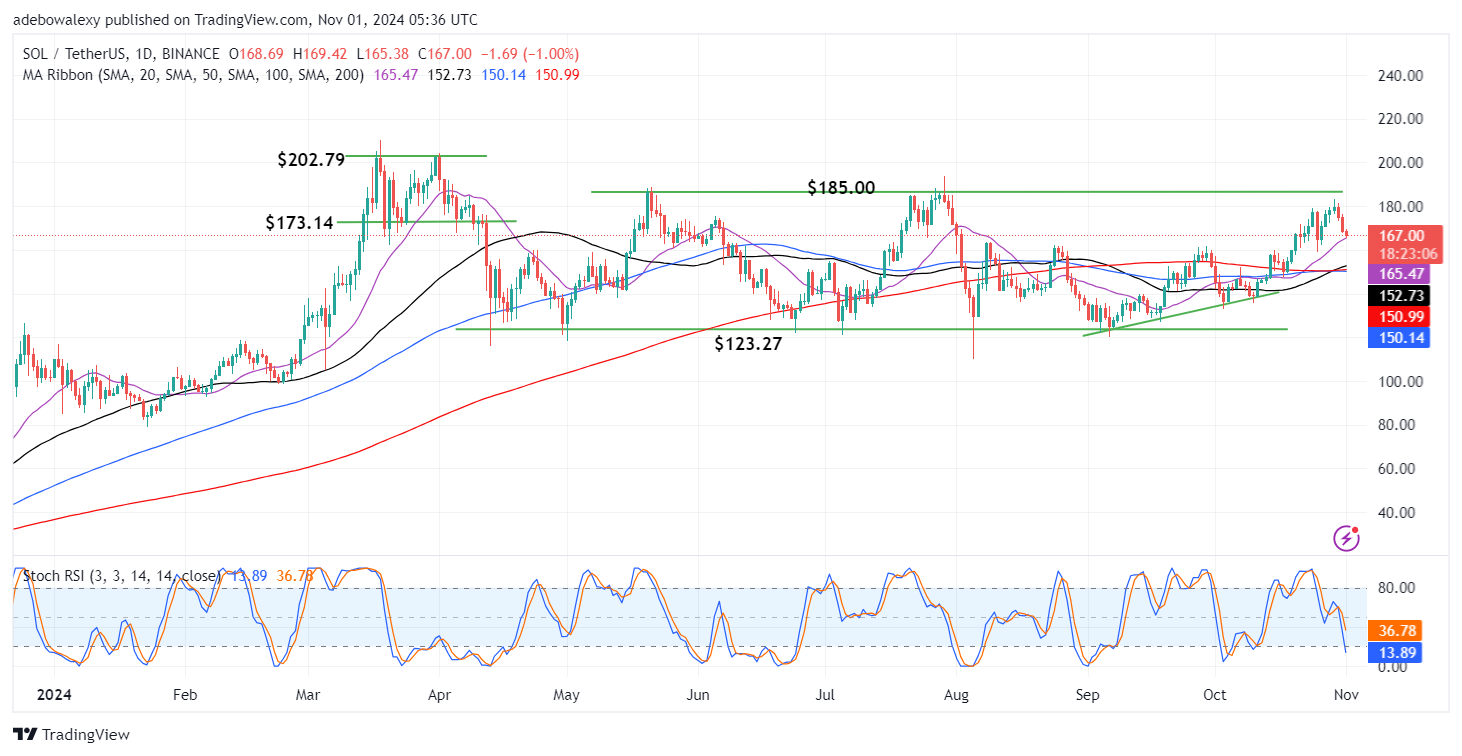
In the ongoing session, Solana is positioned just above the 20-day Moving Average (MA) line. Meanwhile, the current price candle suggests a potential decline in downward momentum on the daily chart. This perspective comes from the size of the candle, which is smaller than the previous two. The Stochastic Relative Strength Index (RSI) lines are seen sharply descending into the oversold region.
Solana Price Prediction: SOL/USDT Market Stands at a Critical Point
The recent price movements in the Solana market suggest that headwinds have been dominant over the past sessions. However, with the price action now just above the 20-day MA and with the candle appearing smaller than in the last two sessions, there are signs that market forces might support a possible rebound from this indicator line.
Nevertheless, the trajectory of the Stochastic RSI lines suggests that the market may still drop below the 20-day MA line. Additionally, considering the gap between the two Stochastic RSI lines, volatility appears significant, and there could be substantial price declines if price action falls below the 20-day MA curve.
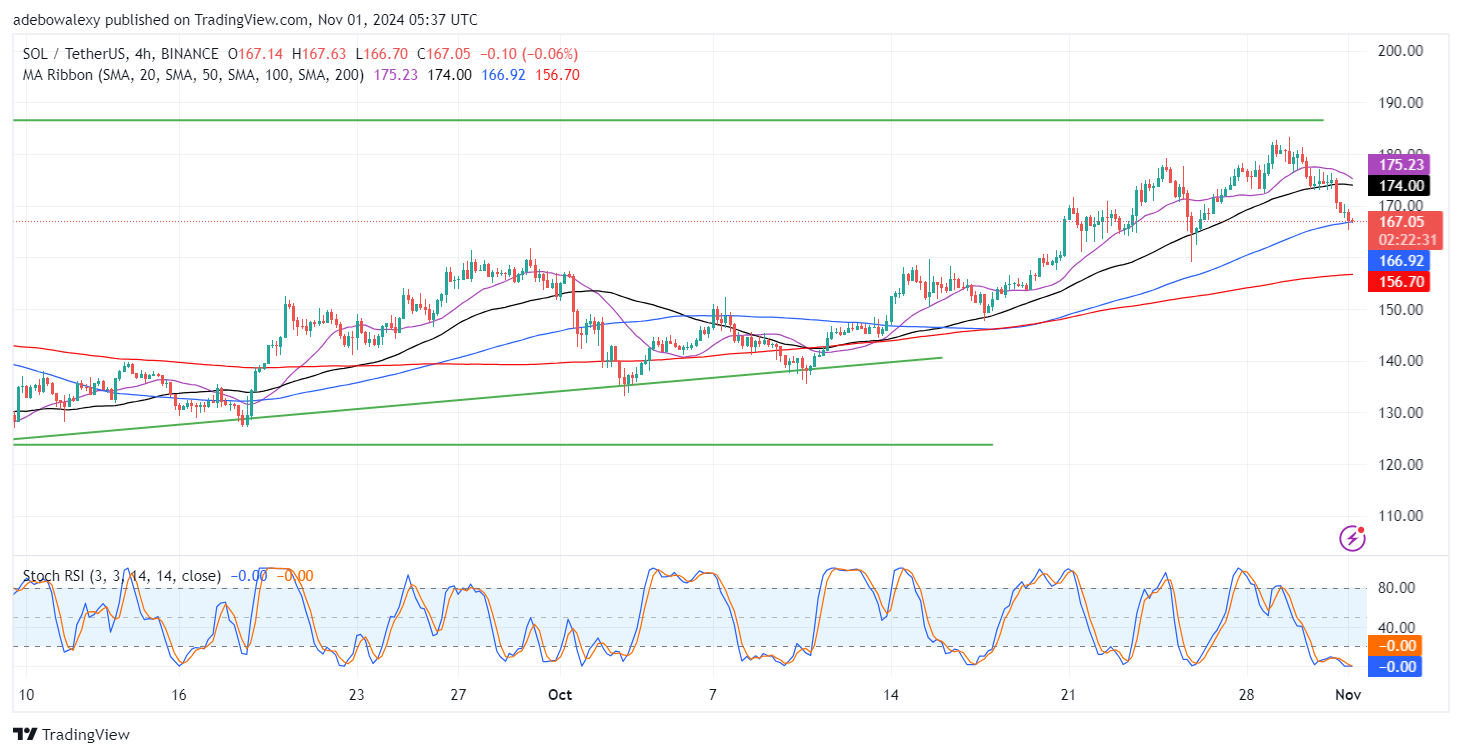
Solana Price: SOL/USDT Downward Retracement May Persist (4-Hour Chart)
In the Solana 4-hour chart, price action has fallen below the 20- and 50-day MA lines. Currently, the last price candle stands atop the 100-day MA line. The last candle suggests that the downward retracement is encountering some resistance. However, the Stochastic RSI lines have reached zero in the oversold region and are showing signs of sideways movement.
The 100-day MA line appears to provide a strong base for price movement at the moment. However, there are indications that this support might be breached. The 20- and 50-day MA lines are approaching a convergence above the price action, while the Stochastic RSI is preparing to move sideways in the oversold region. These factors offer little bullish momentum and hint that the downward retracement may extend to the $160.00 level.