Solana (SOL) Price Prediction: SOL/USDT Price Action Recoils off $123.21
Estimated Reading Time: 3 minutes
Don’t invest unless you’re prepared to lose all the money you invest. This is a high-risk investment and you are unlikely to be protected if something goes wrong. Take 2 minutes to learn more

Solana (SOL) Price Prediction: July 5
The Solana daily market initially showed some correlation to BTC as it dipped below the $56,000 threshold. However, the support level at $123.21 is still holding, with price activity in the Solana market rebounding moderately upwards.
SOL/USDT Long-term Trend: Bearish (Daily Chart)
Key Price Levels:
Resistance Levels: $9.00, $12.00, and $15.00
Support Levels: $8.00, $6.00, and $4.00
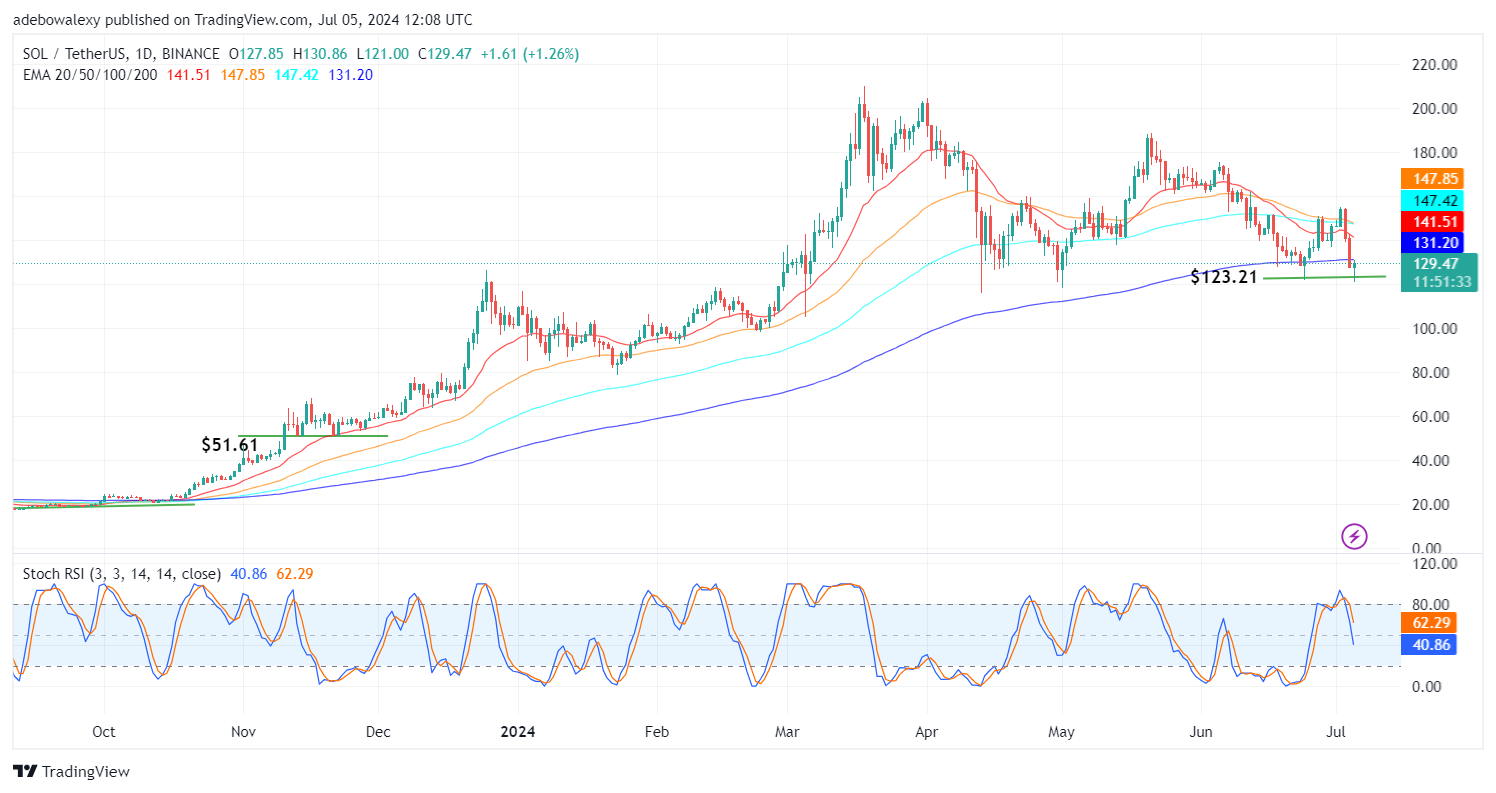
The Solana market has rebounded from the aforementioned support level after a two-session price descent. Nevertheless, price action remains below the Exponential Moving Average (EMA) lines. Despite the upward correction, the Stochastic Relative Strength Index (SRSI) lines are still dipping towards the 50 level of the indicator. It is noteworthy that upward market forces have caused some notable upward contractions.
Solana Price Prediction: SOL/USDT Market Stays Bearish Despite Seen Upside Correction
The Solana daily market can still be considered bearish. This opinion stems from the fact that upside forces are still vulnerable, as price action remains below the EMA lines. However, it can be seen from the upside correction that upward forces are putting up some fight at the defensive line of the $123.21 threshold. Consequently, they have been able to wrestle out some recovery.
Meanwhile, the SRSI indicator suggests that the recorded correction is too weak. The lines of the indicator can be seen falling steeply towards lower levels. Technically, this effectively places further upward corrections against the trend.
SOL/USDT Medium-term Trend: Solana Upside Correction Hits a Rejection (4H Chart)
On the SOL/USDT 4-hour market, price activity seems to have made some impressive progress over the past two sessions. However, as the market closed in on the $130.00 mark, a downward rejection occurred. Price action in the market is still below all the EMA lines. However, the SRSI lines can still be seen rising upward from the oversold region.
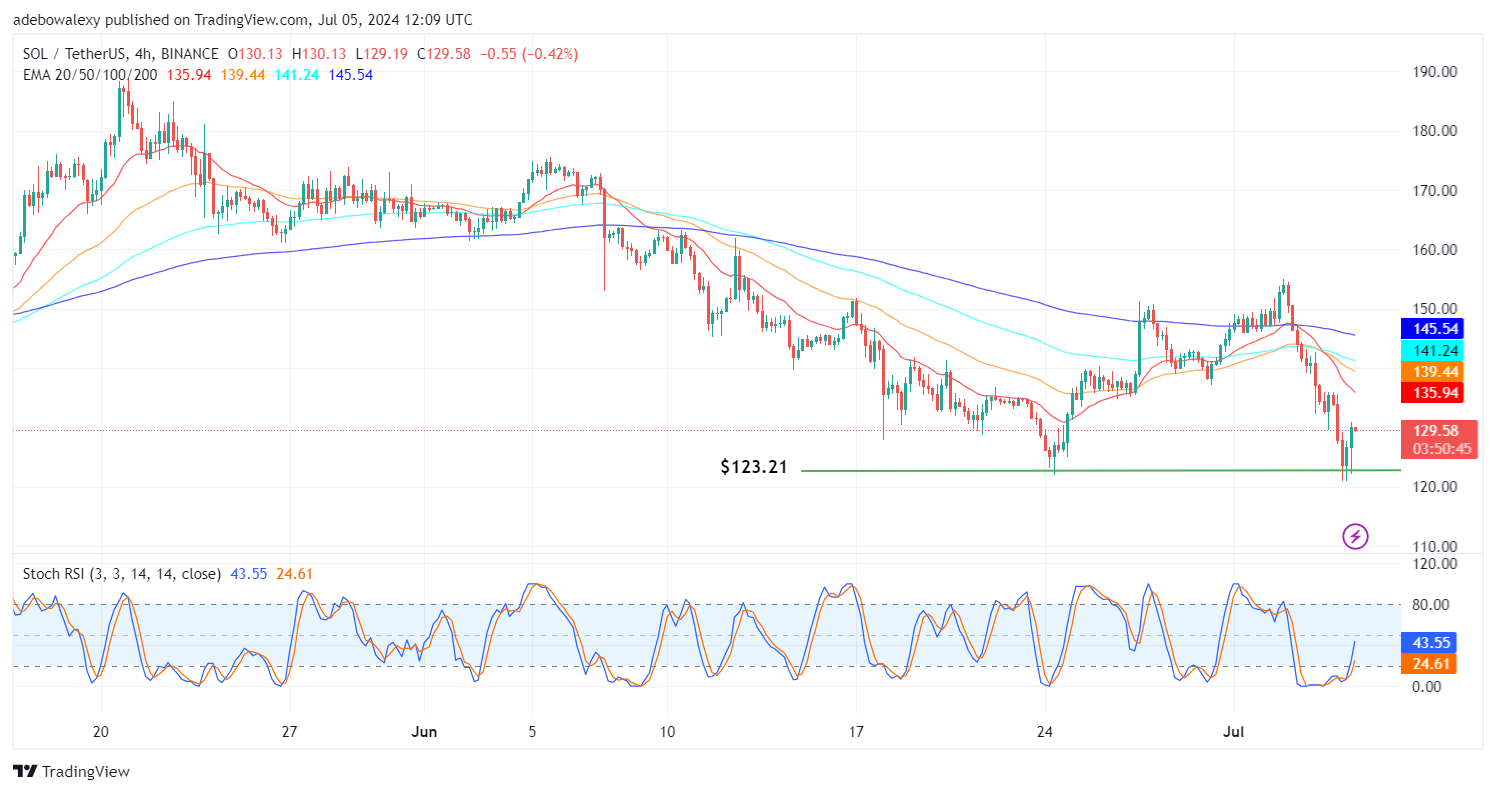
Solana has made some impressive recovery over recent sessions in the 4-hour market. Additionally, the SRSI lines can be seen rising upward, confirming the upside correction. However, the market is still under the control of downward forces since it remains below the EMA curves. As such, the upside correction may still be reversed. Therefore, traders may want to wait until price movement crosses over the 20-day EMA line at least. This is because downward forces may drive the market through the $123.21 support level.