Solana (SOL) Price Prediction: SOL/USDT Stays Above the $140 Price Level
Estimated Reading Time: 3 minutes
Don’t invest unless you’re prepared to lose all the money you invest. This is a high-risk investment and you are unlikely to be protected if something goes wrong. Take 2 minutes to learn more
Solana (SOL) Price Prediction: October 11
Although price movement in the Solana daily market can be seen bouncing off a support level in the current session, it appears that the market is maintaining a steady upward path. Therefore, it is necessary to monitor the market for more cues and trading opportunities closely.
SOL/USDT Long-term Trend: Bullish (Daily Chart)
Key Price Levels:
Resistance: $145.00, $150.00, $155.00
Support: $140.00, $135.00, $130.00
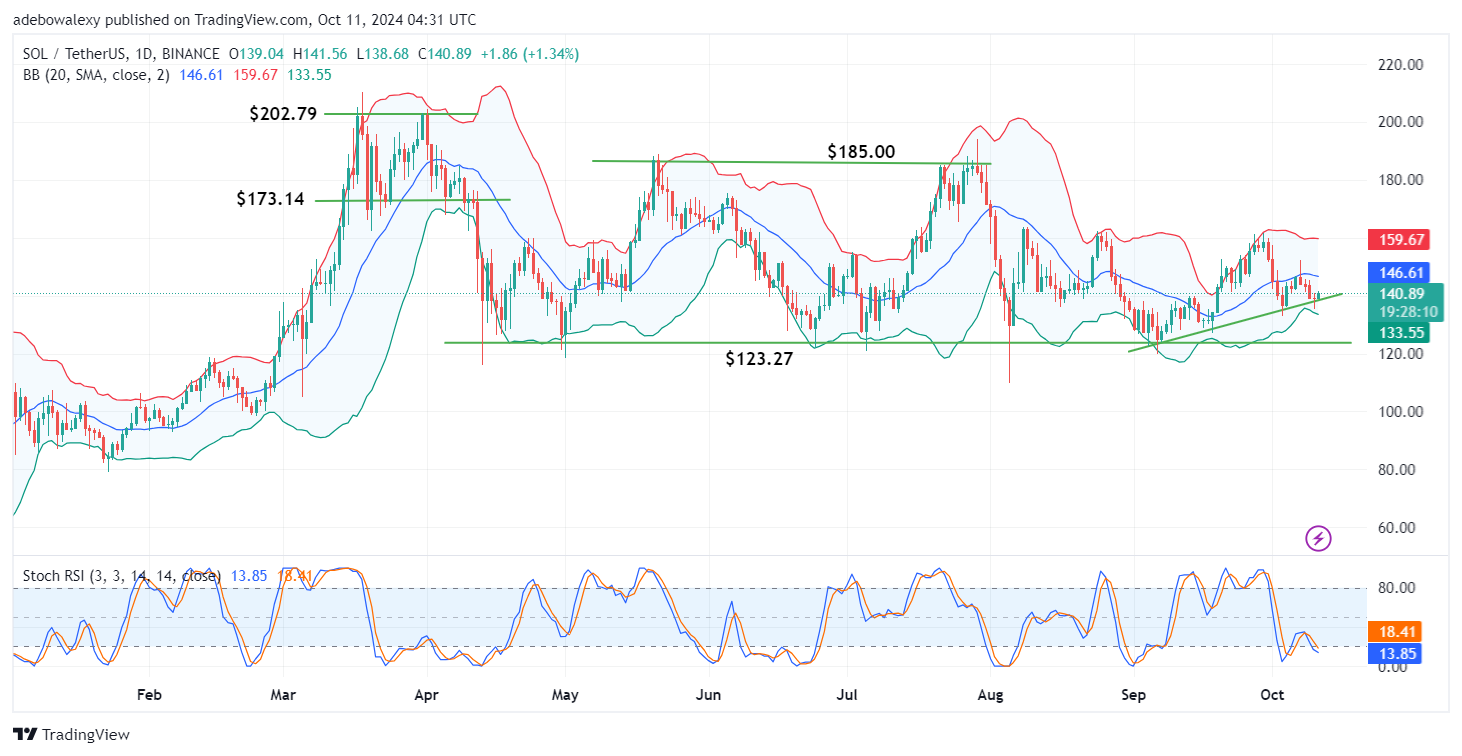
The last price candle on the daily chart appears green and is rebounding off an upward-sloping trendline. This is the case despite price activity being below the middle limit of the Bollinger Bands (BB) indicator. Meanwhile, the Stochastic Relative Strength Index (Stochastic RSI) indicator lines are in the oversold region, but the leading line seems to be moving towards the lagging one.
Solana (SOL) Price Prediction: SOL/USDT Market May Attempt to Keep Rising
The current session in the Solana daily price chart suggests that buying activity may have resumed, which has kept the token’s price above the $140 threshold. It has also helped maintain the integrity of the upward-sloping trendline, which spans from the recent market low to the latest price candle on the chart.
The Stochastic RSI lines are generally dipping towards the oversold region. However, it can be observed that the leading line of the indicator is now bending sideways toward the lagging line. This suggests that the market may continue upward if bullish forces manage to trigger a bullish crossover.
Solana (SOL) Price Prediction: SOL/USDT Buyers Are on the Front Foot (4-Hour Chart)
On the Solana 4-hour chart, price activity has rebounded upwards. A new session has begun, and bulls are taking the lead, as evidenced by the color of the most recent price candle. Although this price candle is still below the middle limit of the BB indicator, there is a suggestion that the market may proceed higher.
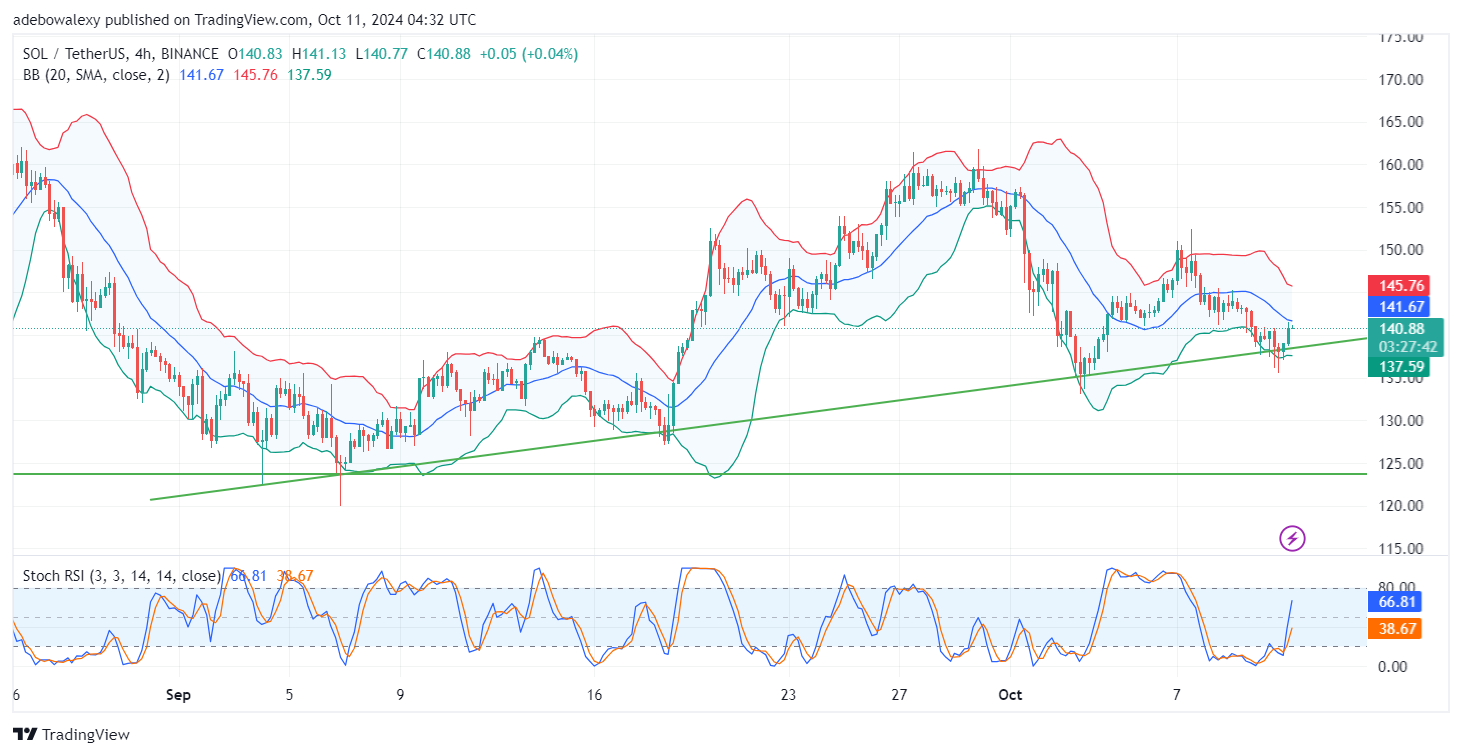
The Stochastic RSI indicator lines are still rising steeply, indicating that upward momentum remains strong in the market. However, while traders aim for a price increase beyond the middle limit of the BB indicator towards the $144.00 mark, they should take into account the immediate resistance at the $141.67 price level.