Synthetix (SNXUSD) Converges Within a Triangle Pattern
Estimated Reading Time: 2 minutes
Don’t invest unless you’re prepared to lose all the money you invest. This is a high-risk investment and you are unlikely to be protected if something goes wrong. Take 2 minutes to learn more
SNXUSD Analysis – Price Converges Within a Triangle Pattern
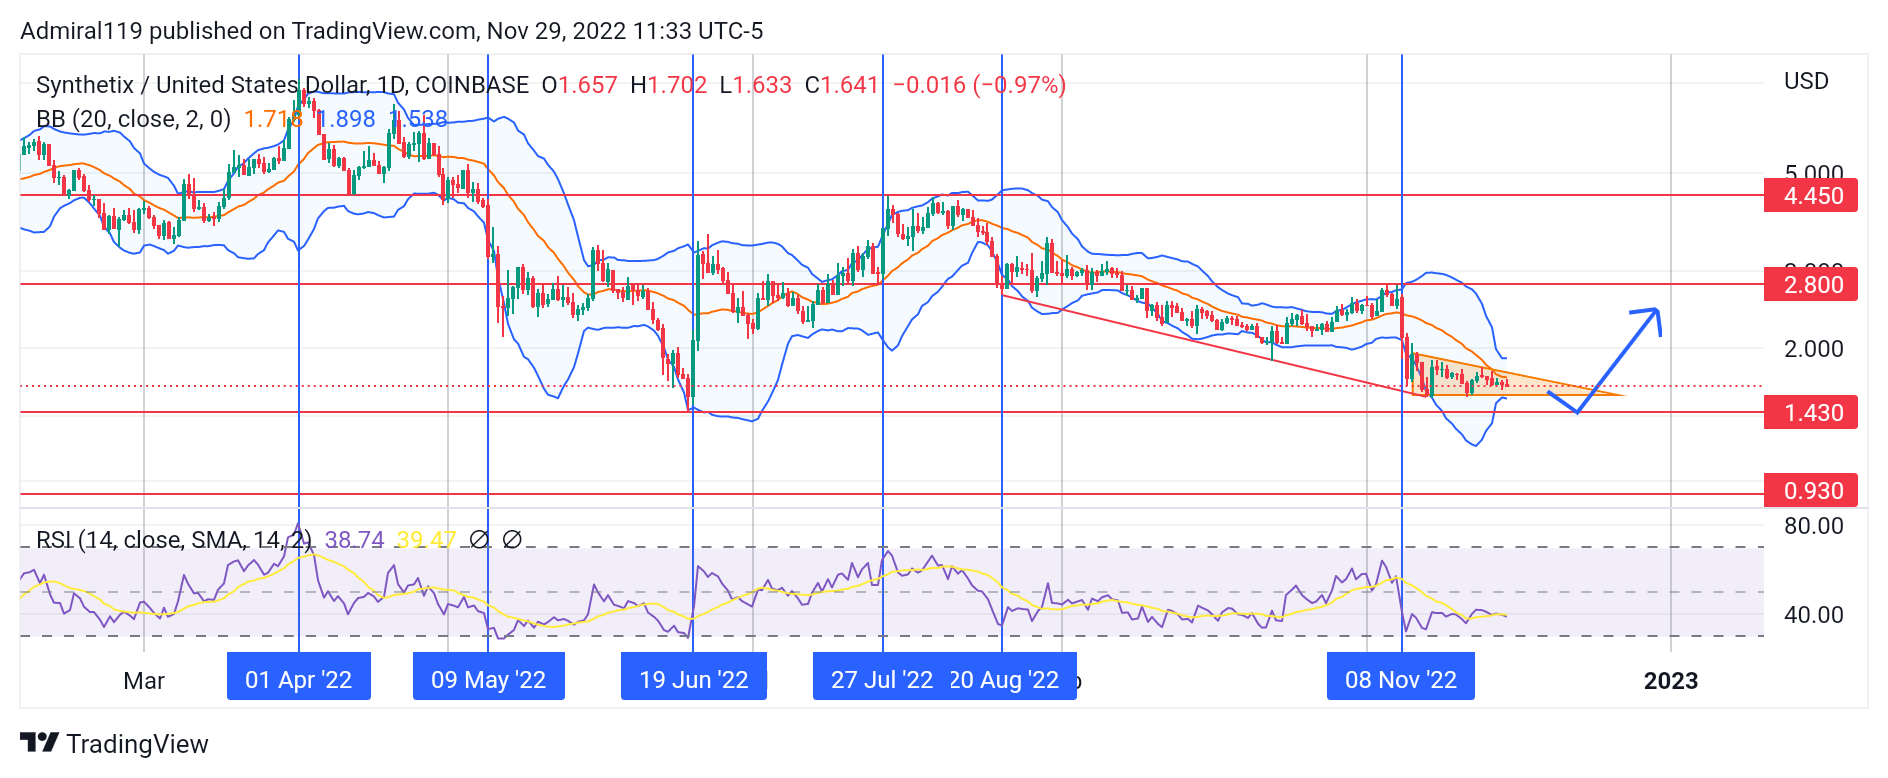
SNXUSD converges within a triangle pattern. The market’s order flow has been bearish since SNXUSD attained its local high in the second quarter of the year. The price was rejected at the $2.800 resistance on November 9, 2022. The Bollinger Bands are currently contracting, thereby indicating that the current market is now consolidating.
SNXUSD Significant Zones
Demand Zones: $1.430, $0.930
Supply Zones: $2.800, $4.450
Following price rejection at the $2.800 price level, the price headed downward to converge within a triangle pattern. This triangle pattern emerged due to the tug-of-war between the SNXUSD sellers and buyers. SNXUSD hit its local high for the year on April 2, 2022. The market began to decline massively after the emergence of the failure swing. The SNXUSD sellers’ intention was revealed when a marubozu candlestick formed due to the selling pressure at the $4.450 price level. This marubozu candlestick was formed on May 9, 2022. The market kept sinking until a lower low was formed in an oversold region.
On June 19, 2022, the price formed yet another lower low. The correspondence between these two consecutive lows on the Relative Strength Index (RSI) indicated a hidden bullish divergence. On July 27 and August 20 of this year, a double bottom was created at the $2.800 price level, but it got invalidated due to the selling pressure from the $4.450 supply zone. Before the consolidation within the triangle pattern, SNXUSD was algorithmically declining to diagonal support that emerged at the formation of the double bottom.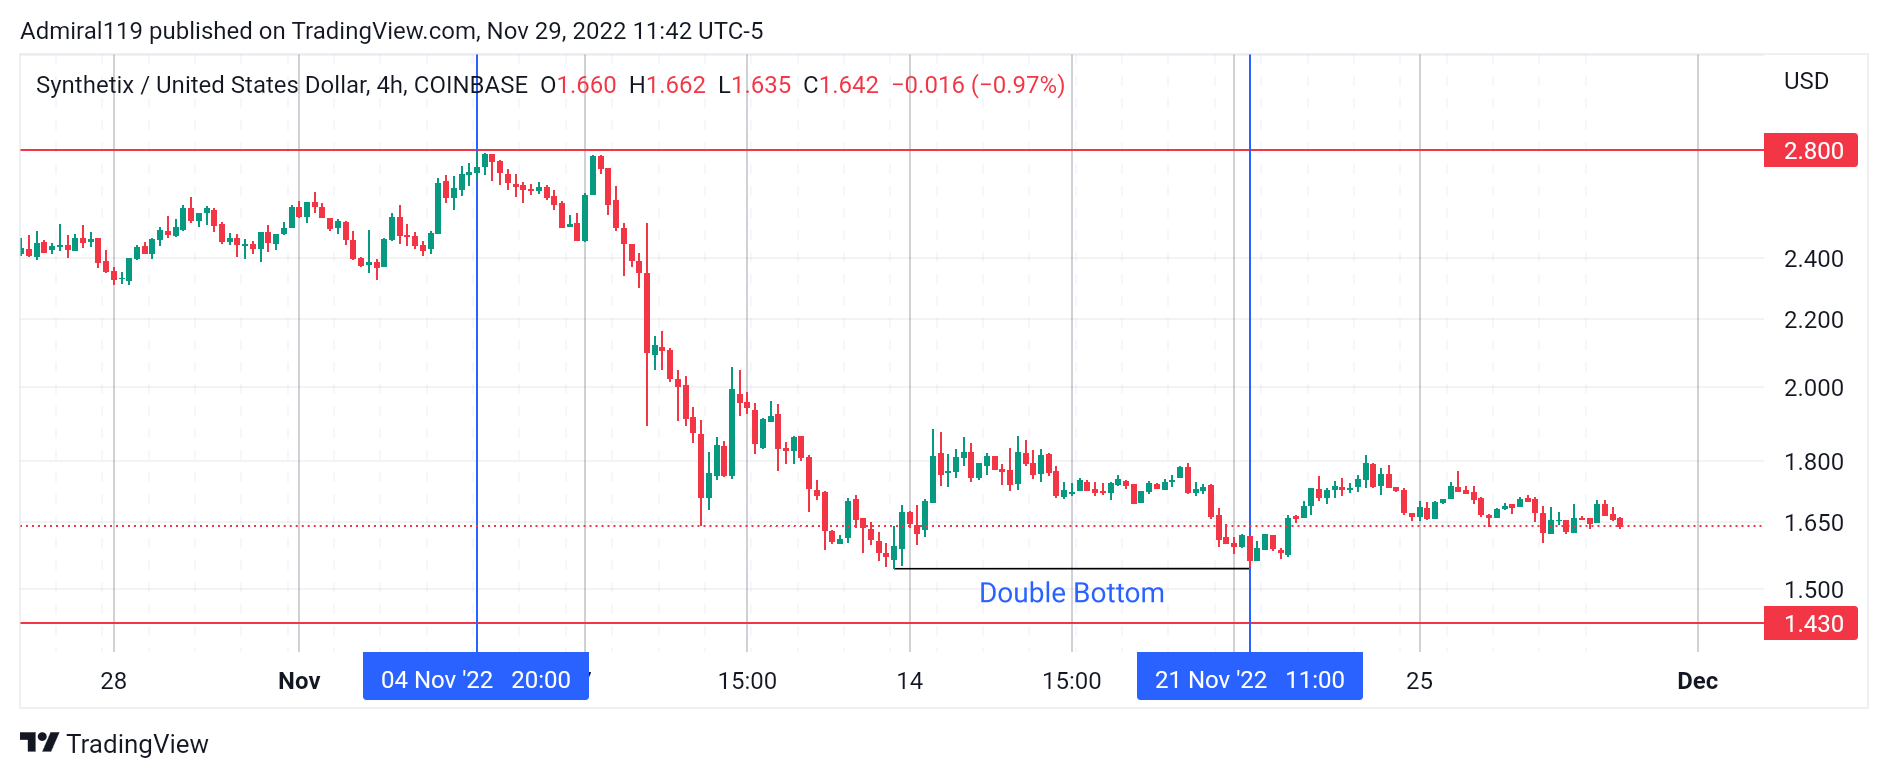
Market Expectation
Since the $2.800 resistance got hit on November 4, 2022, SNXUSD has been descending the crest on the four-hour chart. A double bottom was recently formed on November 21, 2022. Price is expected to seek sell-side liquidity below the double bottom in the triangle pattern before pulling back to the upside.
You can purchase Lucky Block here. Buy LBLOCK
Note: Cryptosignals.org is not a financial advisor. Do your research before investing your funds in any financial asset or presented product or event. We are not responsible for your investing results.