Wall Street Memes (WSM/USD) Price Is Lowly, Rising Bounces
Estimated Reading Time: 3 minutes
Don’t invest unless you’re prepared to lose all the money you invest. This is a high-risk investment and you are unlikely to be protected if something goes wrong. Take 2 minutes to learn more

Wall Street Memes Price Prediction – May 26
A series of price movements are being systematically constrained, subtly countering bullish momentum within market activity and reflecting the valuation dynamics of the Wall Street Memes coin relative to the U.S. dollar, as the market is low, rising bounces are in its moving phase.
The WSM/USD market remains confined within a well-defined horizontal channel between $0.001 and $0.0005, underscoring the risk of false breakdowns amid tightly balanced market dynamics. The measured pace of trading activity warns against overreacting to minor drops, as it signals a phase of controlled accumulation and distribution rather than impulsive sell-offs. Current price behavior highlights a tactical equilibrium, cautioning traders to avoid misinterpreting range-bound fluctuations as the start of a sustained downward move.
WSM/USD Market
Key Levels
Resistance levels: $0.0015, $0.002, $0.0025
Support levels: $0.0005, $0.0004, $0.0003
WSM/USD – 4-hour Chart
The medium-term chart (4-hour chart) of the WSM/USD market is lowly, rising bounces in its inputting methods.
The stochastic oscillators have continued to gradually curve northbound toward the 80 level, affirming that buying momentum is building and bulls are gaining control. The Bollinger Bands are slightly downward sloping with narrowing width, portending that buyers are positioning for potential long entries and partial profit-taking in anticipation of a breakout.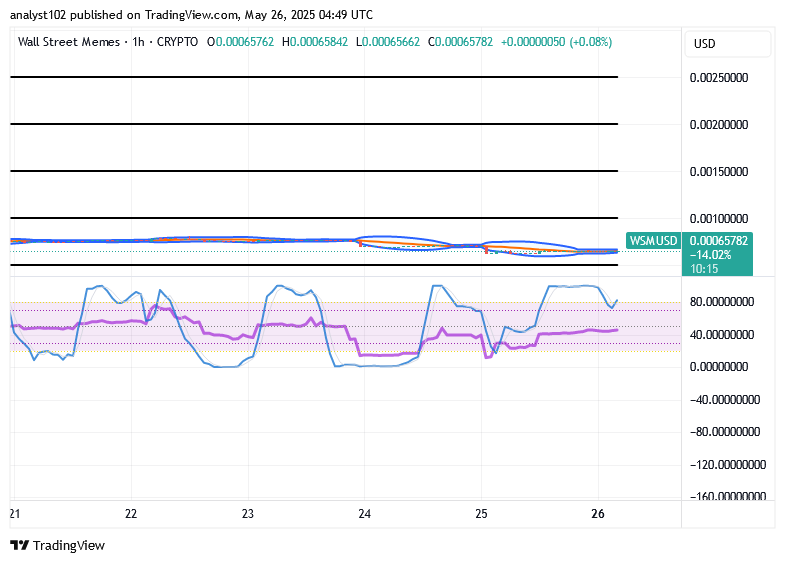
Are the WSM/USD market’s conditions warning shorts as consolidation deepens and oversold signals emerge?
Practically logical, the present WSM/USD market’s conditions are warning signal notes against getting steady movements to the negative direction, as the crypto-economic trade is lowly, rising bounces in its inputting pattern.
As momentum rebuilds and the price remains steady above key support, conditions increasingly favor an upside breakout—systematic buying is needed to sustain this setup, especially as indicators strengthen, consolidation tightens, and buyers gain control across multiple timeframes, reinforcing the bullish outlook.
WSM/USD 1-hour chart
The 1-hour chart of the short-term setup showcases that the crypto-economic price is lowly, rising bounces in its inputting methods.
The stochastic oscillators are holding firmly in overbought territory, indicating that recent bullish energy remains intact—suggesting sustained underlying strength—while near-term entrants may patiently await an optimal pullback for better entry positioning. Meanwhile, the Bollinger Bands are tightening horizontally between $0.001 and $0.0005, signaling a stable consolidation zone that typically precedes a clear directional resolution.
You can now trade BIGTIMEUSDT and WSMUSDT contracts on Bybit—explore new opportunities today with enhanced trading features and seamless execution!
🚀 BIGTIMEUSDT & WSMUSDT Contracts now on Bybit!
— Bybit (@Bybit_Official) October 12, 2023
Dive into new trading opportunities with 1-25x leverage. Plus, they’re now on Bybit Futures Grid Bot! Start trading now.
📈 BIGTIME: https://t.co/FAQlbhnzAh
📈 WSM: https://t.co/pb2y2AfMBE#CryptoTrading #Bybit