XRP (XRP/USDT) Seeks More Gains Amidst Declining Momentum
Estimated Reading Time: 3 minutes
Don’t invest unless you’re prepared to lose all the money you invest. This is a high-risk investment and you are unlikely to be protected if something goes wrong. Take 2 minutes to learn more
XRPUSDT Mid-term Analysis: Ranging
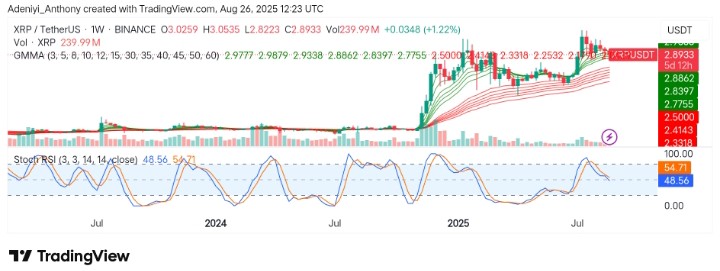
Currently, XRP against Tether is holding steady after a period of strong volatility, with the price consolidating around $2.890. Right now, the market anticipates a move above or below critical levels with the traded volume showing healthy participation. whether the asset will sustain its support zone and push higher. Volume levels show healthy participation, while the Stochastic RSI is cooling off, suggesting room for a potential renewed uptrend.
Also, the price action has been respecting the Guppy Multiple Moving Averages (GMMA), hinting at a continuation as XRP trades at $2.8933 with over 239 million traded volumes.
Technical Indicators
Major Resistance Levels: $3.0500, $3.3500, and $3.6500
Major Support Levels: $2.7755, $2.5000, and $2.3300
XRP Technical Analysis
On the weekly timeframe, XRP against Tether has been in a macro bullish structure since breaking above $2.000 at the beginning of the year. However, the recent sideways movement above $2.800 reflects consolidation rather than weakness. As it stands, since the GMMA ribbons are fanning upward, the long-term trend strength remains intact.
Meanwhile, the Stochastic RSI appears to be crossing down from mid-levels, showing short-term cooling, but not a deep selloff, which could play out before another leg up. At the moment, only a decisive breakout above $3.0500 could ignite fresh upward momentum, while losing $2.7755 may test $2.5000 despite the fact that overall bias remains bullish above $2.7755.
XRP Simply Following Patterns
At the moment, the market for XRP on the shorter timeframe seems to be consolidating above Fibonacci support at $2.74. However, the market appears to be giving an ABC wave structure above the August low.
To this end, holding above the August trough means the coin’s value has the potential to extend above $3.000; otherwise, a fall below this level would indicate a deeper correction.
XRP/USDT Daily Analysis: Expectations
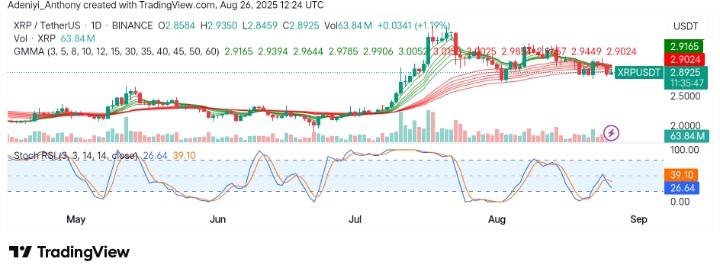
On the daily timeframe, XRP is trading around $2.8900, showing signs of compression around the GMMA ribbons. However, the Stochastic RSI sits near the oversold zone, suggesting downside momentum is weakening. As it stands, buyers seem to be defending the current area, preventing the price from breaking below key support.
To this end, volume has slightly thinned, which is typical of consolidation phases before a breakout. If bulls hold above $2.89–$2.92, a rebound toward $3.00–$3.05 is likely. Failure to hold could push the price toward $2.85 or even $2.77, aligning with weekly supports.
You can purchase crypto coins here. Buy Crypto