Annual Forecast for UMA (UMAUSD) (2022)
Estimated Reading Time: 2 minutes
Don’t invest unless you’re prepared to lose all the money you invest. This is a high-risk investment and you are unlikely to be protected if something goes wrong. Take 2 minutes to learn more
UMA Annual Forecast – Price Is Stuck in Consolidation Above $8.200
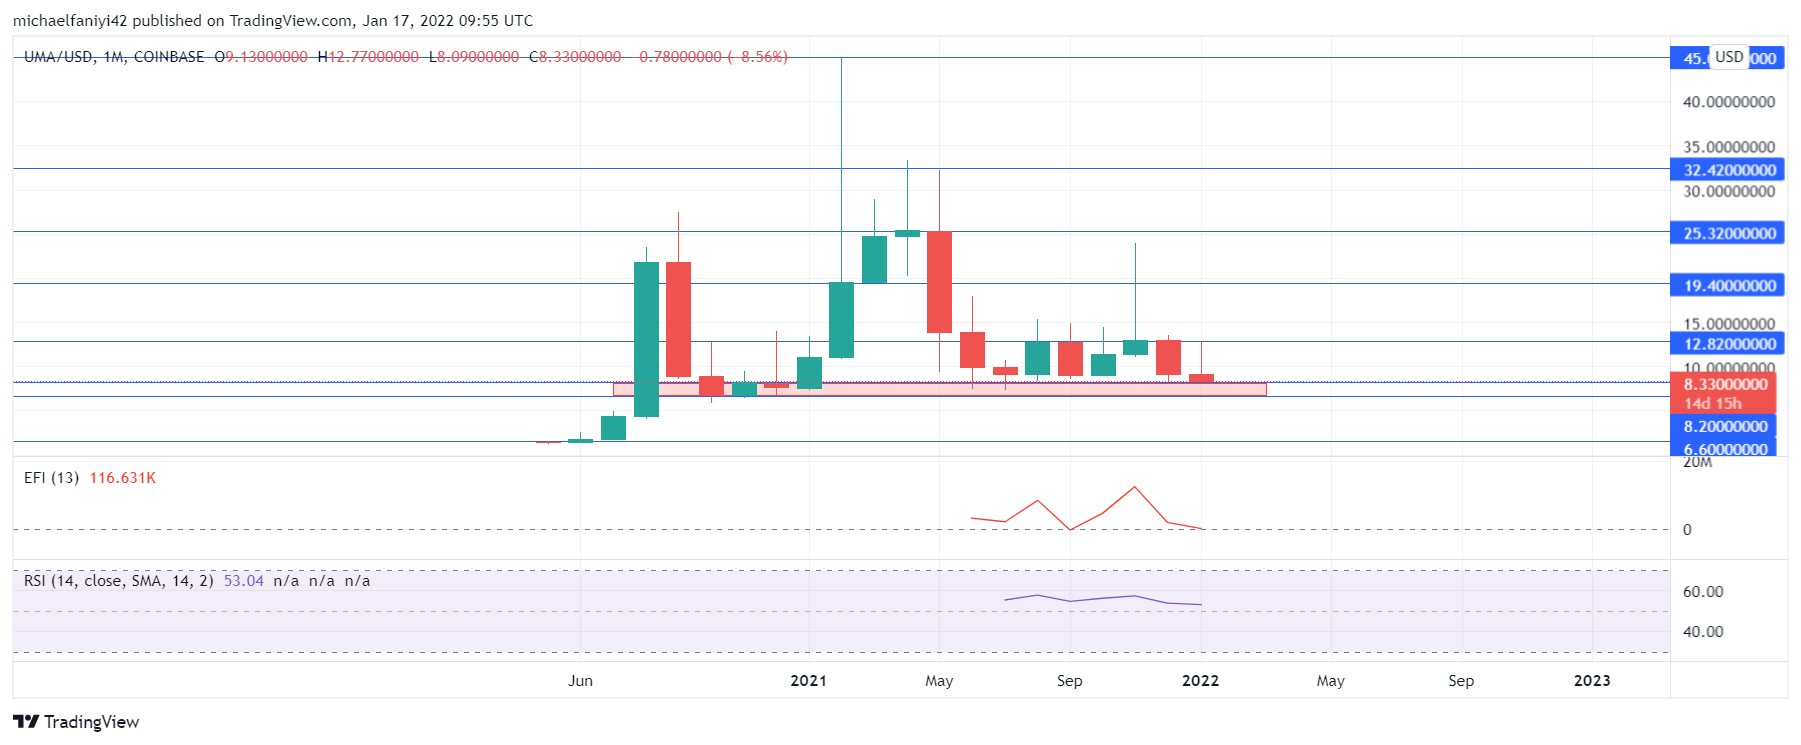
The annual forecast for UMA is to continue in consolidation until market forces disrupt the price structure. Since the middle of last year, the price has been stuck in consolidation above the strong $8.200 monthly demand level. Not much progress has been made since then. The only notable activity was in November 2021, when the price spiked to break its malaise. But it didn’t have much effect as the market closed that same day below the $8.200 resistance level.
UMA Important Zones
Resistance Zones: $12.800, $25.320, $32.420
Support Zones: $8.200, $6.600, $1.500
UMA Long Term Plan: Ranging
UMA hit its all-time high at $45.000 in February 2021. And though the market will close far lower than that height in that month, the market keeps pressing upward with each passing month. It was not until May 2021 that sellers finally got a grip on the market and reversed all the progress that had been made. UMA then plunged to the $8.200 demand level, and since then, a barrier has been placed on the price at $12.800.
Hence, what is visible in the market from mid-2021 to January 2022 is a ranging pattern in which UMA is zigzagging between $12.800 and $8.200. The Elders Force Index has its power line at a positive value, showing that despite the ranging movement of the market in a low price zone, bulls have the most tendency in the market. The Relative Strength Index echoes the same sentiment as the signal line remains above mid-level.

UMA Medium Term Plan: Bullish
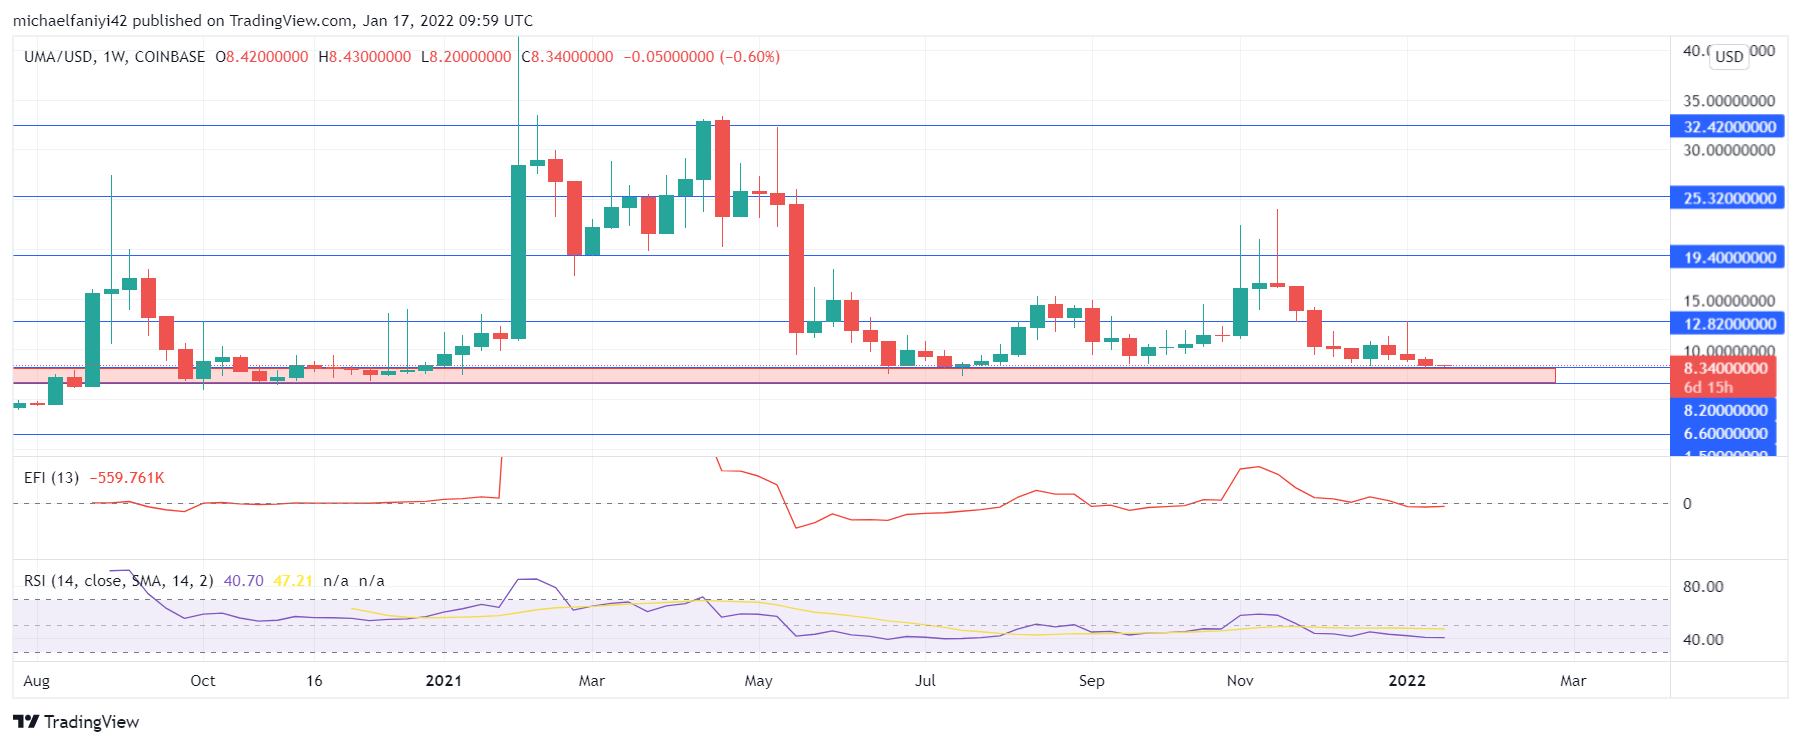
At the moment, the price has crashed back to the demand level at $8.200, which both the EFI indicator and the RSI have reacted sharply to. The EFI shows a switch of power to the bears while the RSI plunges below the midline. While the market is still stuck in consolidation, we can forecast that a rise to the resistance level at $12.800 will follow immediately.
You can purchase crypto coins here: Buy Tokens
Note: Cryptosignals.org is not a financial advisor. Do your research before investing your funds in any financial asset or presented product or event. We are not responsible for your investing results.