
Free Crypto Signals Channel
DeFi Coin Price Prediction – September 8
 Most Popular
- 2-5 Signals Daily
- 82% Success Rate
- Entry, Take Profit & Stop Loss
- Amount To Risk Per Trade
- Risk Reward Ratio
The DeFi Coin price prediction is consolidating, if the bulls increase their momentum, the price would shoot higher.
DEFC/USD Long-term Trend: Ranging (1D Chart)
Key Levels:
Resistance levels: $0.125, $0.130, $0.135
Support levels: $0.045, $0.040, $0.035
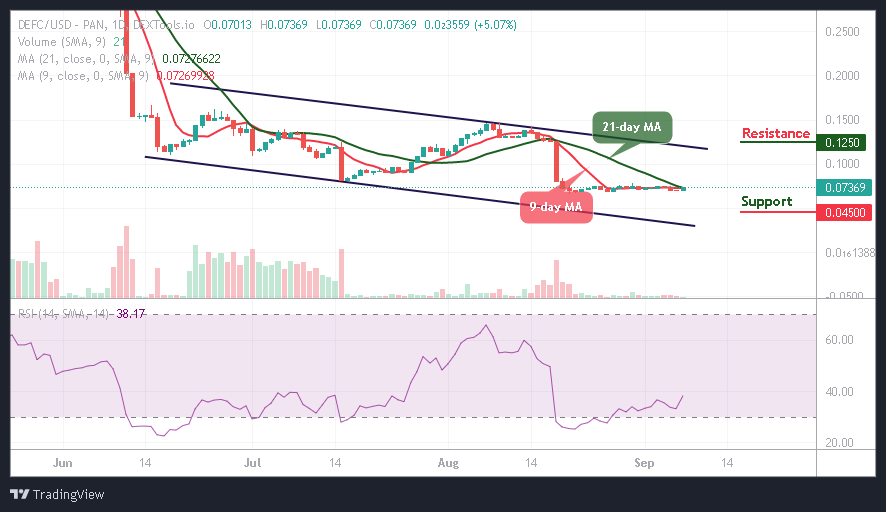
DEFC/USD is ready for the upside as the coin prepares for a recovery above the 9-day and 21-day moving averages. However, if the bulls increase their momentum and penetrate the resistance level at $0.075, then, the price would shoot higher by heading towards the upper boundary of the channel.
DeFi Coin Price Prediction: DEFC Will Spike to the Upside
According to the daily chart, if the DeFi Coin price can experience an increasing volume coupled with a bullish regroup, it will begin to correct gain significantly on the upside. On the contrary, the bears could become severe with more losses for the new buyers to enter as the next support levels could be located at $0.045, $0.040, and $0.035 respectively.
In the meantime, the DeFi Coin price will continue to move to the upside as the coin aims to hit the potential resistance levels of $0.125, $0.130, and $0.135. The technical indicator Relative Strength index (14) is moving to cross above the 40-level, suggesting bullish movement for the coin.
DEFC/USD Medium-term Trend: Ranging (4H Chart)
The DeFi Coin is trading below the 9-day and 21-day moving averages as revealed in the chart, but the coin is getting ready for the upward movement. Therefore, should the price break above the moving averages, the market may experience an upward trend which could touch the resistance level at $0.075 and above.

Meanwhile, DEFC/USD is likely to retreat a little bit, if the coin breaks below the lower boundary of the channel; it may hit the support at $0.067 and below. However, the technical indicator Relative Strength Index (14) moves to cross below 35-level, which may allow new buyers to enter the market.
You can purchase DeFi Coin here. Buy DEFC
