Polkadot Declines but Fluctuates above the $5.00 Support
Estimated Reading Time: 2 minutes
Don’t invest unless you’re prepared to lose all the money you invest. This is a high-risk investment and you are unlikely to be protected if something goes wrong. Take 2 minutes to learn more
Polkadot (DOT) Long-Term Analysis: Bullish
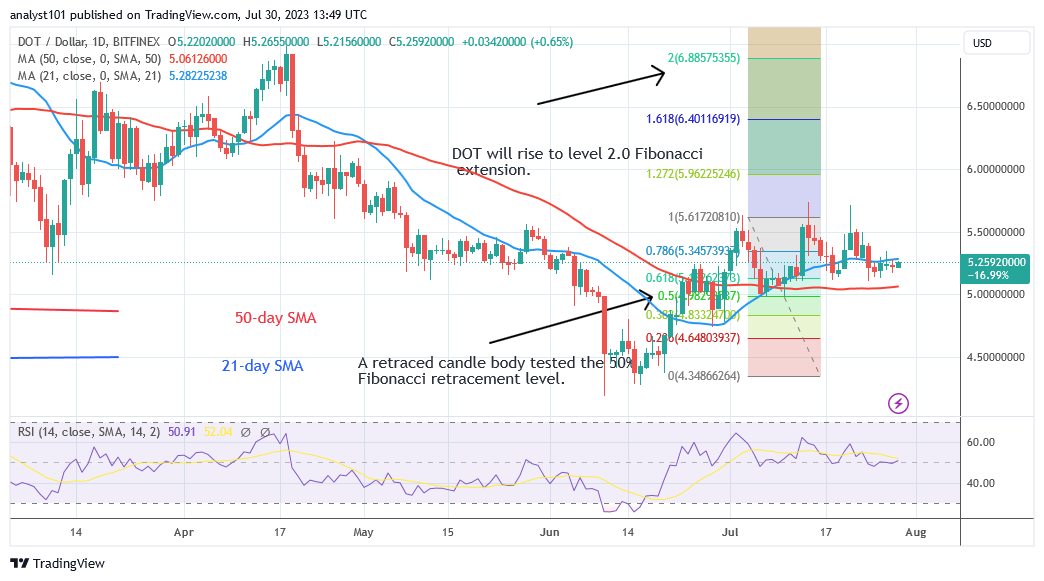
Polkadot (DOT) price has remained in the upward trend zone as it fluctuates above the $5.00 support . The Bulls have made three failed attempts to break the previous high. Following each rejection, the crypto asset will go below or above the 21-day SMA. Today, the altcoin is trading at $5.26, well below the 21-day simple moving average.
The DOT price is now trading between the moving average lines and could be limited to a range-bound move. As the cryptocurrency is limited between the moving average lines, the present drop has subsided. When the moving average lines are broken, the altcoin will trend.
Technical indicators:
Major Resistance Levels – $10, $12, $14
Major Support Levels – $8, $6, $4
Polkadot (DOT) Indicator Analysis
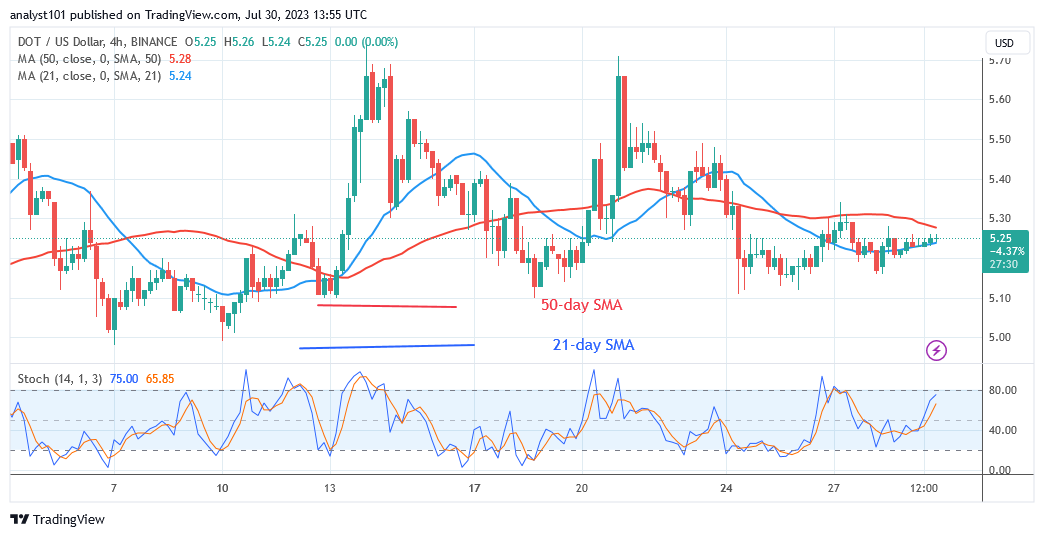
The DOT price has decreased to Relative Strength Index level 50 for period 14. Price equilibrium for the altcoin has been reached as supply and demand balance. The coin resumed its sideways move when it landed between the moving average lines. The bullish momentum has stalled above the daily Stochastic threshold of 70.
What Is the Next Direction for Polkadot (DOT)
Polkadot has started to move in a sideways direction as it fluctuates above the $5.00 support. The price of the altcoin will be within the moving average lines, or between $5.00 and $5.50. When these levels are breached, the altcoin will trend.
You can purchase Lucky Block here. Buy LBLOCK
Note: Cryptosignals.org is not a financial advisor. Do your research before investing your funds in any financial asset or presented product or event. We are not responsible for your investing results