Polkadot Drifts Downward to Its Range above $6.20
Estimated Reading Time: 2 minutes
Don’t invest unless you’re prepared to lose all the money you invest. This is a high-risk investment and you are unlikely to be protected if something goes wrong. Take 2 minutes to learn more

Polkadot (DOT) Price Long-term Trend: Ranging
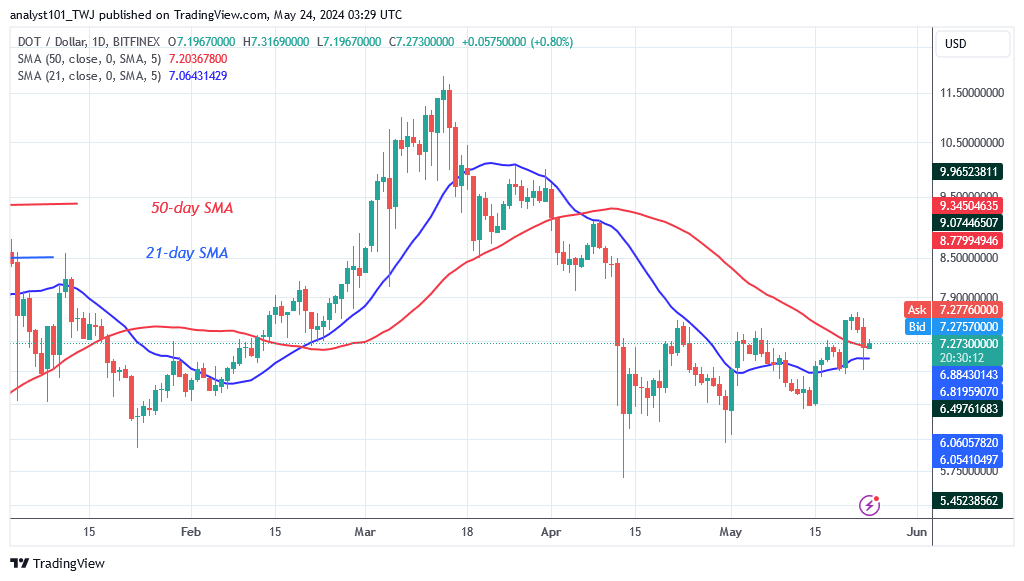
Polkadot’s (DOT) price breaks above the moving average lines but drifts downward to its range above $6.20. The price recovery peaked at $7.69, then retreated to a low of $6.91. The cryptocurrency is drifting downward between the moving average lines. On the downside, if the altcoin falls below the moving average lines, the DOT price will retest its current support of $6.20.
The range-bound move, or present fluctuation, will continue if the cryptocurrency falls between the moving average lines. DOT/USD is currently worth $7.20.
Technical indicators:
Key Resistance Levels: $10, $12,$14
Key Support Levels: $8, $6, $4
Daily Chart Indicators Reading:
Polkadot’s price has continued to swing both below and above the moving average lines. On May 20, the bulls broke above the moving averages. The altcoin is dropping back after being rejected at its recent high. Doji candlesticks limit the movement of DOT prices.
General Outlook for Polkadot (DOT)
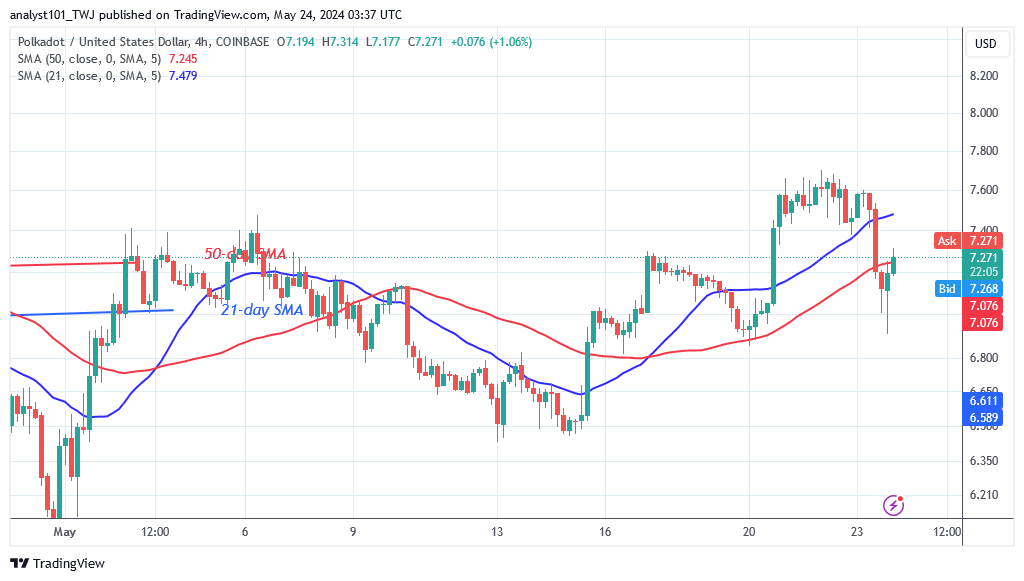
Polkadot faces rejection at the high of $7.69 as it drifts downward to its range above $6.20. On the 4-hour chart, the altcoin has twice tried and fallen to the $7.00 support level. The cryptocurrency asset is currently trading in a band of $6.20 to $7.30. The crypto signal is negative because of the rejection at the recent high.
You can purchase Lucky Block here. Buy LBLOCK
Note: Cryptosignals.org is not a financial advisor. Do your research before investing your funds in any financial asset or presented product or event. We are not responsible for your investing results