Polkadot Moves Into A Narrow Range As It Is Set To Trend
Estimated Reading Time: 2 minutes
Don’t invest unless you’re prepared to lose all the money you invest. This is a high-risk investment and you are unlikely to be protected if something goes wrong. Take 2 minutes to learn more

Polkadot (DOT) Long-Term Analysis: Bearish
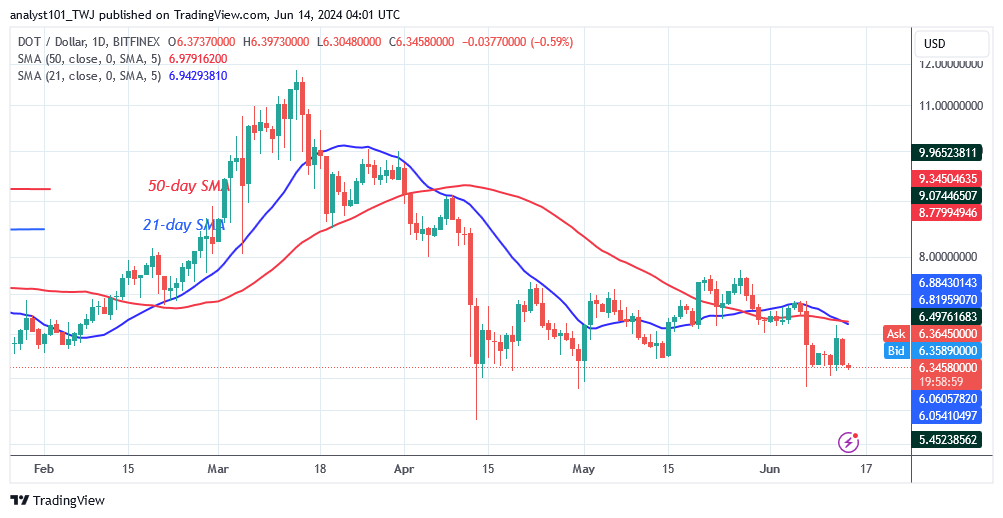
Polkadot’s (DOT) price has fallen to a low of $6.08 and it is set to trend. The bears breached the current support at $6.20, while the bulls bought on dips. Since June 7, the cryptocurrency’s price has remained above the $6.20 support but below the moving average lines. The present price range will persist if the $6.20 support and moving average lines remain intact. Nonetheless, if the bears break through the $6.20 support, the market would drop to a low of $5.67.
On the other hand, if the altcoin rebounds above the $6.30 support level, positive momentum will resume. The bullish momentum will break above the moving average lines, reaching resistance at $7.70. In the meantime, DOT/USD is currently valued at $6.38.
Technical indicators:
Major Resistance Levels – $10, $12, $14
Major Support Levels – $8, $6, $4
Polkadot (DOT) Indicator Analysis
Following the price drop on June 7, the cryptocurrency price bars have fallen below the moving average lines. The altcoin is trading close to the $6.20 support level and below the moving average lines. The moving average lines have repelled the upward move, and the altcoin is now retesting its existing support level of $6.20. The altcoin’s price may bounce or fall.
What Is the Next Direction for Polkadot (DOT)?
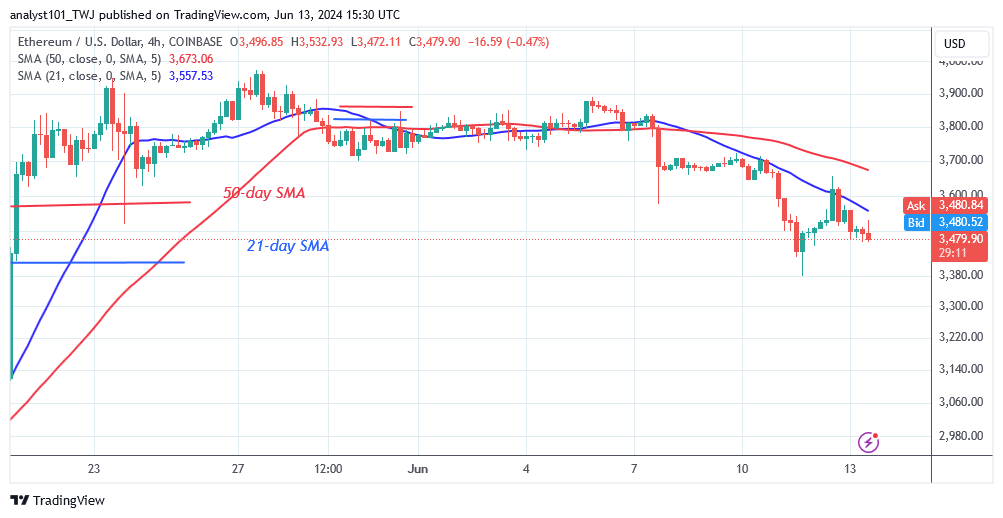
Polkadot has dropped into the bearish trend zone since June 7 and it is set to trend. On the 4-hour chart, the cryptocurrency was initially caught between the moving average lines before dropping below them. The cryptocurrency’s price is consolidating above its current support at $6.20, which could signal a trend. In other words, the crypto signal is range-bound, as the altcoin moves inside a narrow range.
You can purchase Lucky Block here. Buy LBLOCK
Note: Cryptosignals.org is not a financial advisor. Do your research before investing your funds in any financial asset or presented product or event. We are not responsible for your investing results