Polkadot Pauses Above $8.00 and Commences a Reversal
Estimated Reading Time: 2 minutes
Don’t invest unless you’re prepared to lose all the money you invest. This is a high-risk investment and you are unlikely to be protected if something goes wrong. Take 2 minutes to learn more

Polkadot (DOT) Long-Term Analysis: Bearish
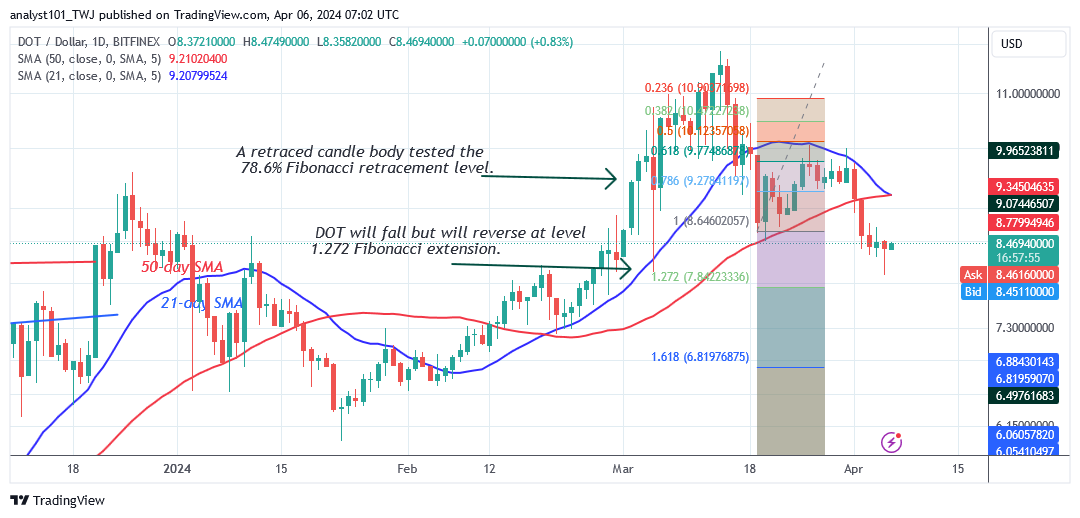
Polkadot’s (DOT) price has fallen below the moving average lines and commences a reversal. The altcoin moved above the $8.00 support level and continued consolidation. The price indication has forecasted a potential reversal of the downtrend. On the March 19 fall, DOT pricing reversed upward, with a candle body testing the 78.6% Fibonacci retracement level.
The correction predicts that the DOT price will decline but then reverse at the 1.272 Fibonacci extension, or $7.84. Meanwhile, the DOT price stands at $8.41 at the time of writing. The price movement has paused above the current support level as Polkadot consolidates.
Technical indicators:
Major Resistance Levels – $10, $12, $14
Major Support Levels – $8, $6, $4
Polkadot (DOT) Indicator Analysis
The price bars are now below the moving average lines that were previously trapped. The selling pressure may have subsided below the moving average lines, but it has stopped above the $8.00 support. The lengthy candlestick tail above the present support level implies significant buying demand at lower prices. The moving average lines have a decreasing slope.
What Is the Next Direction for Polkadot (DOT)?
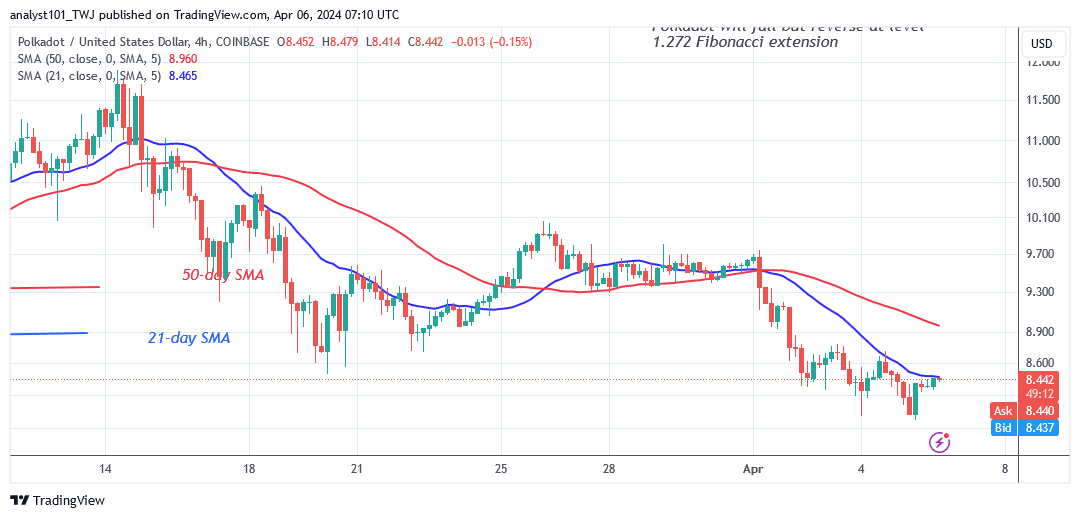
Polkadot’s selling pressure has lessened above the $8.00 support as it commences a reversal. On the 4-hour chart, the cryptocurrency price retested the present support twice before correcting upward. The upward corrective is meeting resistance at the 21-day SMA. If the price breaks and closes above the 21-day SMA, the crypto’s signal will turn positive.
You can purchase Lucky Block here. Buy LBLOCK
Note: Cryptosignals.org is not a financial advisor. Do your research before investing your funds in any financial asset or presented product or event. We are not responsible for your investing results