Polkadot Remains above $5.48 as It Continues Its Sideways Move
Estimated Reading Time: 2 minutes
Don’t invest unless you’re prepared to lose all the money you invest. This is a high-risk investment and you are unlikely to be protected if something goes wrong. Take 2 minutes to learn more
Polkadot (DOT) Long-Term Analysis: Bearish
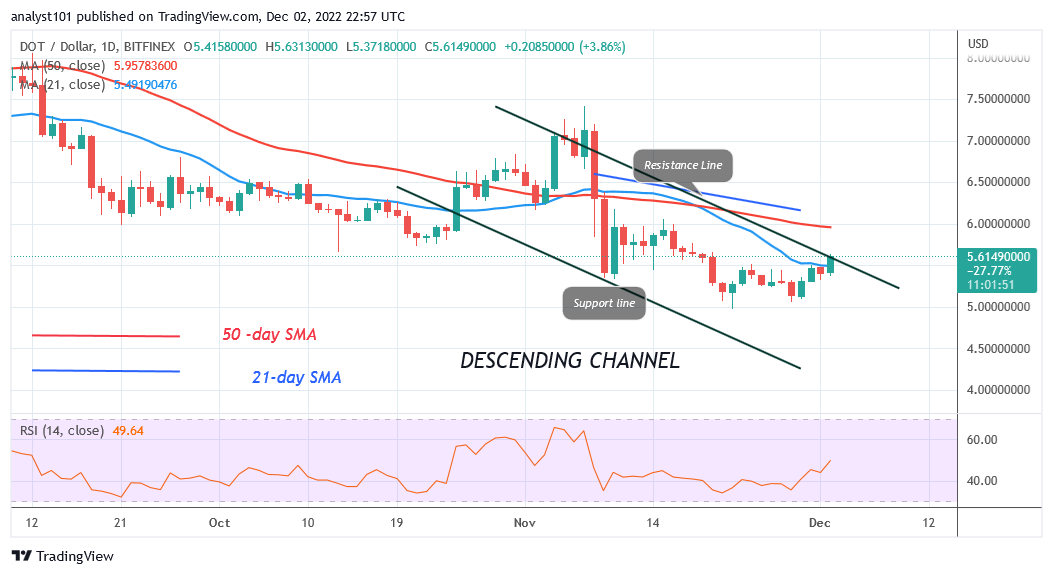
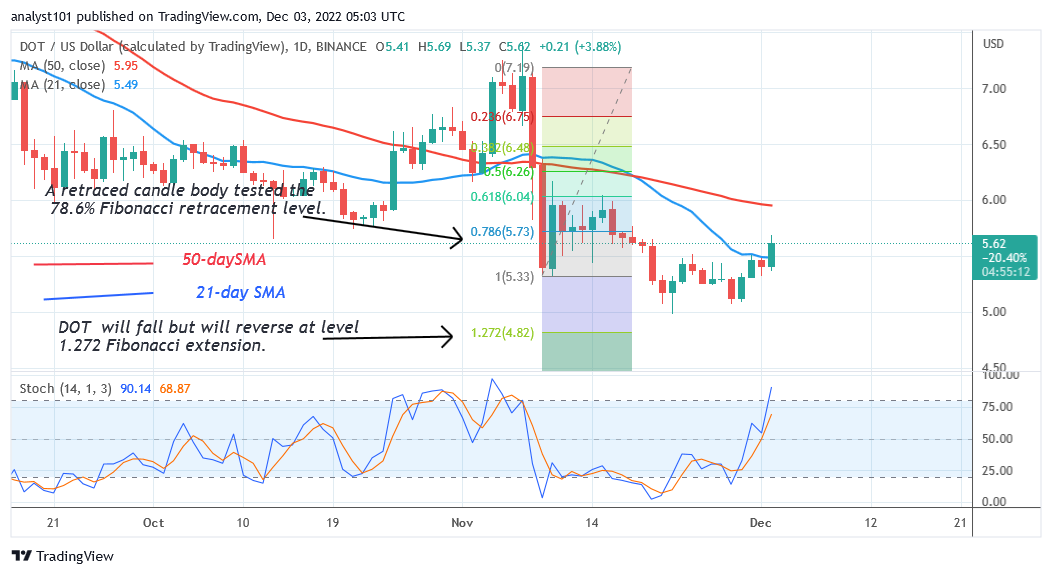
Polkadot (DOT) is trading above the 21-day SMA as it continues its sideways move. Polkadot has been caught between the moving average lines since December 2. The price of the cryptocurrency is settling above the SMA of the 21-day line. On the plus side, the DOT price will increase to retest the resistance at $5.70 if the 21-day line SMA support holds. The momentum will continue above the 50- day SMA. The coin will increase, even more, reaching a high of $7.41. On the other hand, selling pressure will pick back up if sellers break through the 21-day line SMA. The altcoin will retest the $5.34 or $5.06 previous low.
Polkadot (DOT) Indicator Analysis
The DOT price is at level 49 on the Relative Strength Index for period 14. It indicates that demand and supply are balanced. While the crypto fluctuates between the moving average lines, its price has remained constant, suggesting that it will likely move in a range. The altcoin’s value is declining, and the daily Stochastic is below level 40. The selling push has led to a bearish exhaustion.
Technical indicators:
Major Resistance Levels – $10, $12, $14
Major Support Levels – $8, $6, $4
What Is the Next Direction for Polkadot (DOT)?
Polkadot is still moving in and out of the moving average lines as it continues its sideways move. Doji candlesticks, which have small bodies and are indecisive, are what define the price movement. If the Doji candlestick dominates the price movement, the sideways movement will continue.
You can purchase crypto coins here. Buy LBLOCK
Note: Cryptosignals.org is not a 1a financial advisor. Do your research before investing your funds in any financial asset or presented product or event. We are not responsible for your investing results