Polkadot Slips Downhill As It Consolidates Above $5.50
Estimated Reading Time: 2 minutes
Don’t invest unless you’re prepared to lose all the money you invest. This is a high-risk investment and you are unlikely to be protected if something goes wrong. Take 2 minutes to learn more

Polkadot (DOT) Long-Term Analysis: Ranging
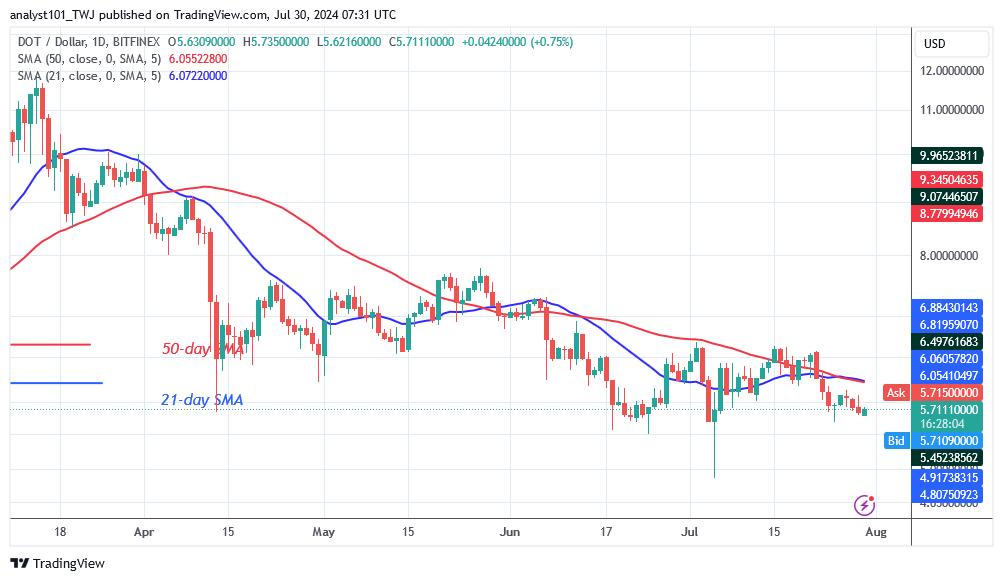
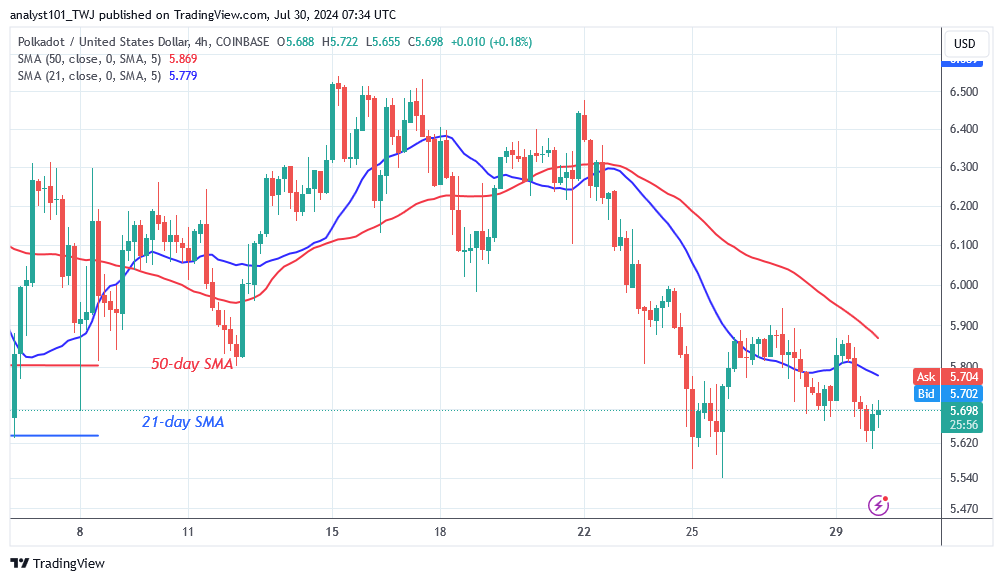
Polkadot’s (DOT) price has dropped below the moving average lines as it consolidates above $5.50. The crypto has been trading in a range of $5.50 to $7.50. The DOT price has dropped to a low of $5.69 at the time of writing. The bears have broken the present support level of $5.50 three times, but bulls have bought the dips. The cryptocurrency’s price has returned to the price range, as the altcoin continues its range-bound movement.
Today, the DOT price is rising after reaching a low point. The upward surge is stopped by the resistance at $6.70. The cryptocurrency is now trading in a limited range of $5.50 to $6.70. Polkadot trades only marginally due to the presence of Doji candlesticks.
Technical indicators:
Major Resistance Levels – $10, $12, $14
Major Support Levels – $8, $6, $4
Polkadot (DOT) Indicator Analysis
The price bars have been below the moving average lines for the past three months. The daily chart’s moving average lines are horizontally flat, indicating a sideways trend. Doji candlesticks are limiting price movement inside the limited range.
What Is the Next Direction for Polkadot (DOT)?
Polkadot’s price has remained inside a trading range as it consolidates above $5.50. The altcoin’s 4-hour chart shows price fluctuations between $5.50 and $5.90 levels. The range has continued to narrow as the altcoin slides to the downside. The altcoin is consolidating above the $5.50 support, indicating that the crypto signal is range-bound.
You can purchase Lucky Block here. Buy LBLOCK
Note: Cryptosignals.org is not a financial advisor. Do your research before investing your funds in any financial asset or presented product or event. We are not responsible for your investing results.