Enjin Coin (ENJUSD) Extends Its Downside Below the $0.288440 Market Zone
Estimated Reading Time: 2 minutes
Don’t invest unless you’re prepared to lose all the money you invest. This is a high-risk investment and you are unlikely to be protected if something goes wrong. Take 2 minutes to learn more
Enjin Coin (ENJUSD) Analysis: Price Is Set to Experience a Bearish Slump
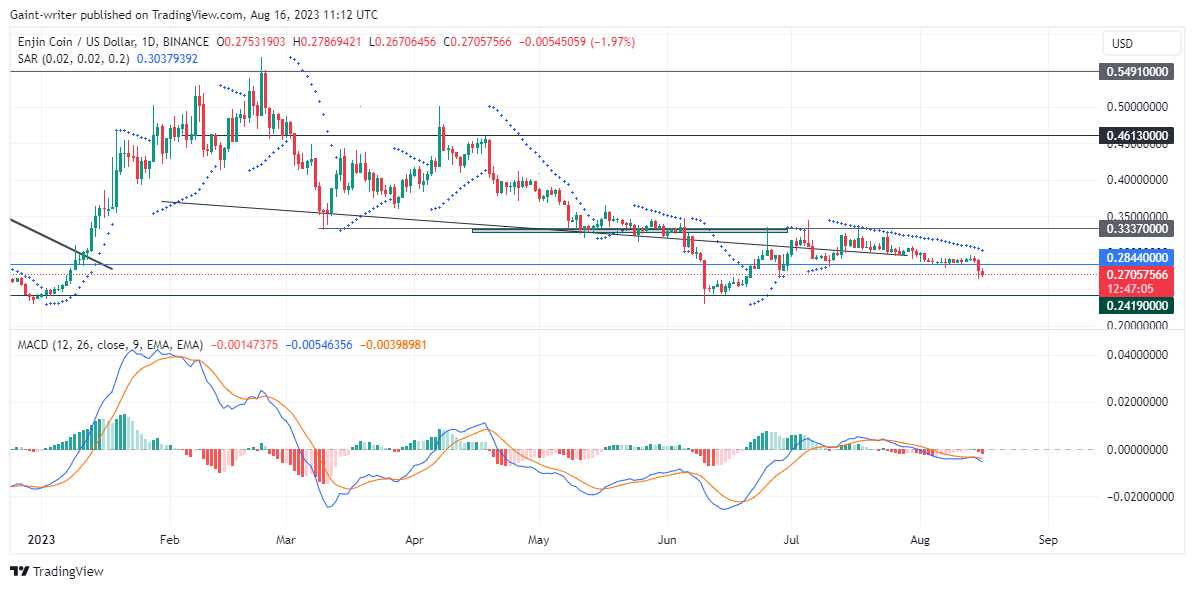
Enjin Coin (ENJUSD) extends its downside below the $0.288440 market zone. This indicates a continuous loss in value for the cryptocurrency. The bears successfully broke through the significant level of $0.288440. They are now showing intentions to dive even further.
Prior to this bearish slump, there was a prolonged period of price accumulation. Throughout July up until the present moment, the market has been consolidating below the $0.333700 market level.
Enjin Coin (ENJUSD) Market Levels
Resistance Levels: $0.549100, $0.461300
Support Levels: $0.33370, $0.241900

The buyers made attempts to change the price structure of ENJUSD, ending the dominance of the sellers back in June. The buyers managed to break above the $0.288400 market level. However, they faced resistance around the $0.333700 level, which led to the price being pushed into a consolidation phase. As the sellers now gain momentum and push the price lower, the availability of buying liquidity decreases.
Looking at the daily chart, the bears have had a significant impact on the price of ENJUSD. The Parabolic SAR (Stop and Reverse) indicator has not yet shown any reversal on the daily chart. This suggests that the bears are still in control following the breakout. Additionally, the MACD (Moving Average Convergence and Divergence) indicator is currently stalling. It indicates a lack of upward momentum in the market.
Market Expectation
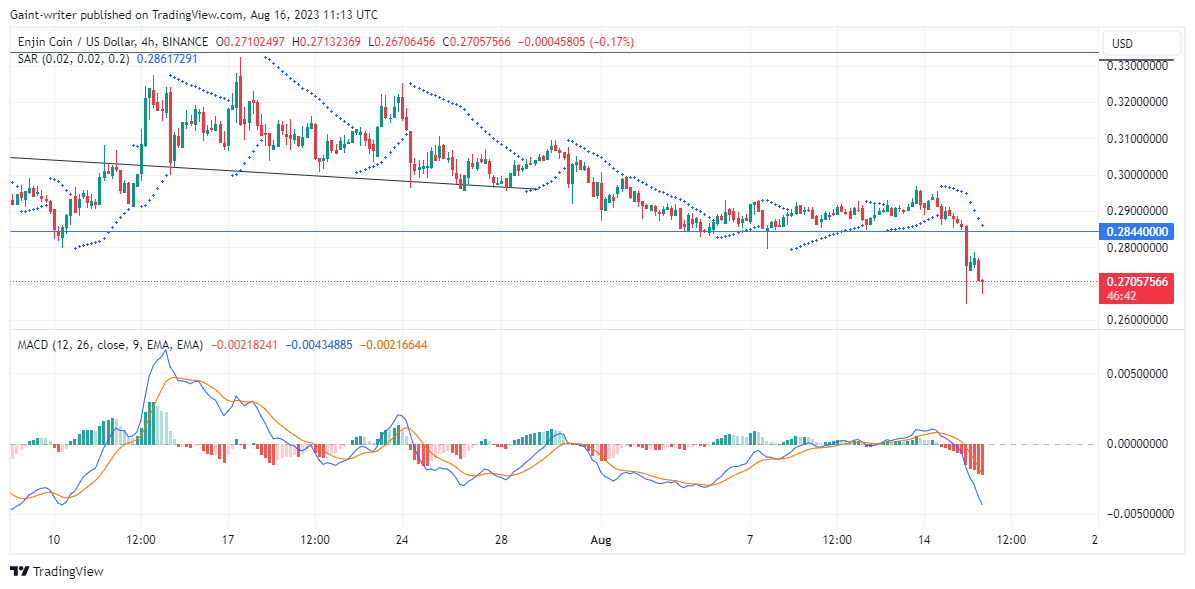
The bearish impact is also evident in the 4-hour chart timeframe. This implies that traders can be on the lookout for potential selling opportunities. If the sell opportunities continue to prolong, a decline in price down to the $0.241900 market zone becomes more plausible.
You can purchase Lucky Block here. Buy LBLOCK
Note: Cryptosignals.org is not a financial advisor. Do your research before investing your funds in any financial asset or presented product or event. We are not responsible for your investing results.