Ethereum (ETH) Declines on the Downside, Faces Rejection at $4,400 High
Don’t invest unless you’re prepared to lose all the money you invest. This is a high-risk investment and you are unlikely to be protected if something goes wrong. Take 2 minutes to learn more

Ethereum Price Long-Term Analysis: Bullish
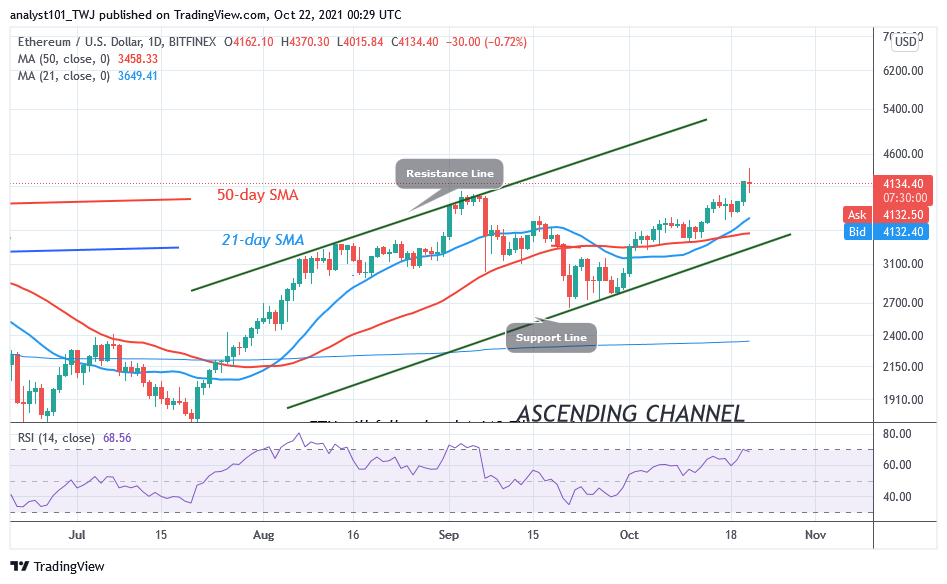
Today, Ethereum’s (ETH) price is fluctuating above the $4,000 support. The biggest altcoin has risen to the high of $4,400 but could not sustain the bullish momentum above the recent high. However, the selling pressure will resume if the bears break below the support level. Today, the market has retraced to the support above the current support. In other words, the market is holding above the 21-day SMA. Bullish candlesticks are indicating the upward movement of the coin.
Ethereum Indicator Analysis
Ether is at level 68 of the Relative Strength Index period 14. It indicates that the market is in the uptrend zone and it is approaching the overbought region. Ether has a bullish crossover. That is, 21-day SMA crosses above the 50-day SMA. This gives a buy signal. Ether is below the 40% range of the daily stochastic. The market is in a bearish momentum.
Technical indicators:
Major Resistance Levels – $2, 600, $2,800, $3,000
Major Support Levels – $1.500, $1, 300, $1,100
What Is the Next Direction for Ethereum?
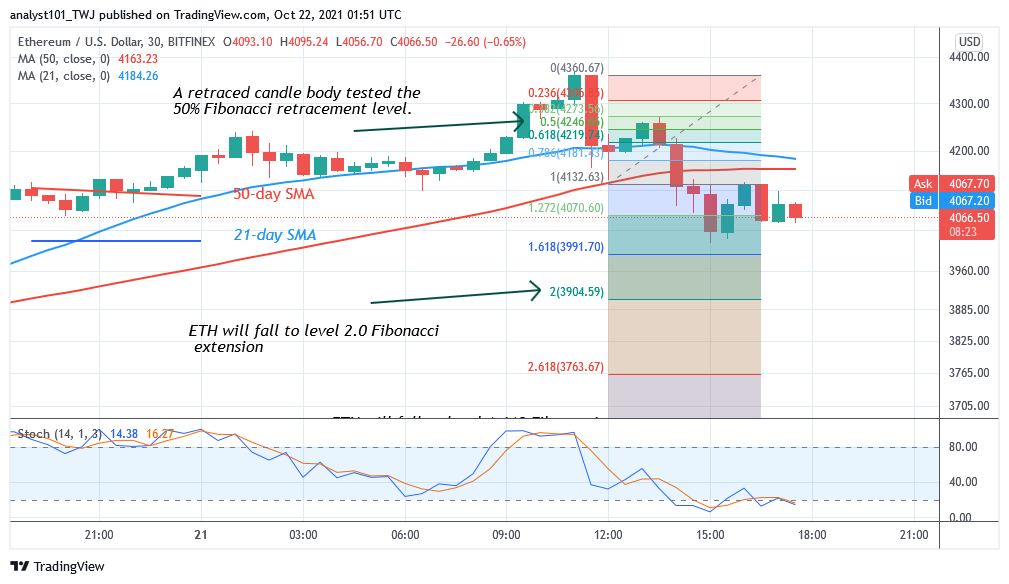
On the 4- hour chart, Ethereum is in a downward move after rejection from the $4,400 resistance zone. Meanwhile, on October 21 uptrend; a retraced candle body tested the 50% Fibonacci retracement level. The retracement indicates that ETH will fall to level 2.0 Fibonacci extension or $3,904.59.
You can purchase crypto coins here. Buy Tokens
Note: Cryptosignals.org is not a financial advisor. Do your research before investing your funds in any financial asset or presented product or event. We are not responsible for your investing results