Ethereum (ETH) Sustains Recent Rallies, Battles Resistance at $2,900
Estimated Reading Time: 2 minutes
Don’t invest unless you’re prepared to lose all the money you invest. This is a high-risk investment and you are unlikely to be protected if something goes wrong. Take 2 minutes to learn more
Ethereum Price Long-Term Analysis: Bullish
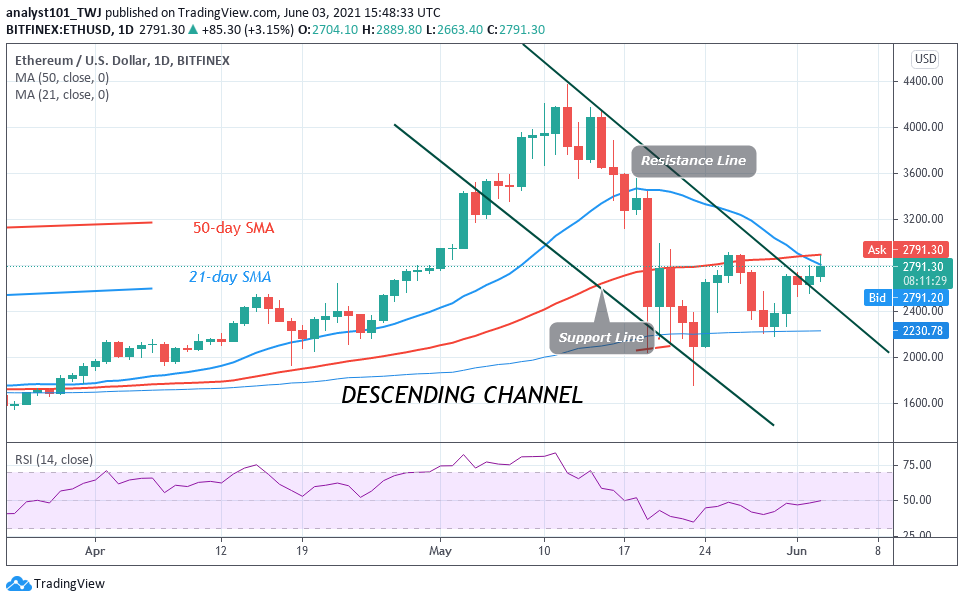
Ethereum is falling after facing rejection from the $2,900 resistance. If price retraces, it may find support above $2,600. Ether uptrend has been facing resistance at the recent high. On May 26, Ethereum rose to $2,900 high. After retesting the resistance twice, the altcoin fell to the previous low above $2,300. Today, altcoin is facing similar rejection. If Ether retraces and finds support above $2,600, the uptrend will resume retesting the $2,900 resistance. A break above the $2,900 will catapult the coin to rally above $3,250. Conversely, if the bears break the $2,600 support, it will decline to $2,300 low.
Ethereum Indicator Analysis
Ethereum is at level 50 of the Relative Strength Index period 14. It indicates that there is a balance between supply and demand. The 21-day and 50-day SMAs are sloping upward indicating the uptrend. The biggest altcoin is above the 80% range of the daily stochastic. It indicates that the market has reached the overbought region of the market,

Technical indicators:
Major Resistance Levels – $2, 600, $2,800, $3,000
Major Support Levels – $1.500, $1, 300, $1,100
What Is the Next Direction for Ethereum?
The biggest altcoin is facing resistance at $2,900 high. The bulls are yet to break the recent high. Meanwhile, on June 1 uptrend; a retraced candle body tested the 61.8% Fibonacci retracement level. The retracement indicates that ETH is likely to rise to level 1.618 Fibonacci extension or $3,011.60.

Note: new.cryptosignals.org is not a financial advisor. Do your research before investing your funds in any financial asset or presented product or event. We are not responsible for your investing results