Ethereum (ETH/USDT) Shows Strong Bullish Momentum Despite Caution
Estimated Reading Time: 3 minutes
Don’t invest unless you’re prepared to lose all the money you invest. This is a high-risk investment and you are unlikely to be protected if something goes wrong. Take 2 minutes to learn more
Ethereum Long-term Analysis: Bullish
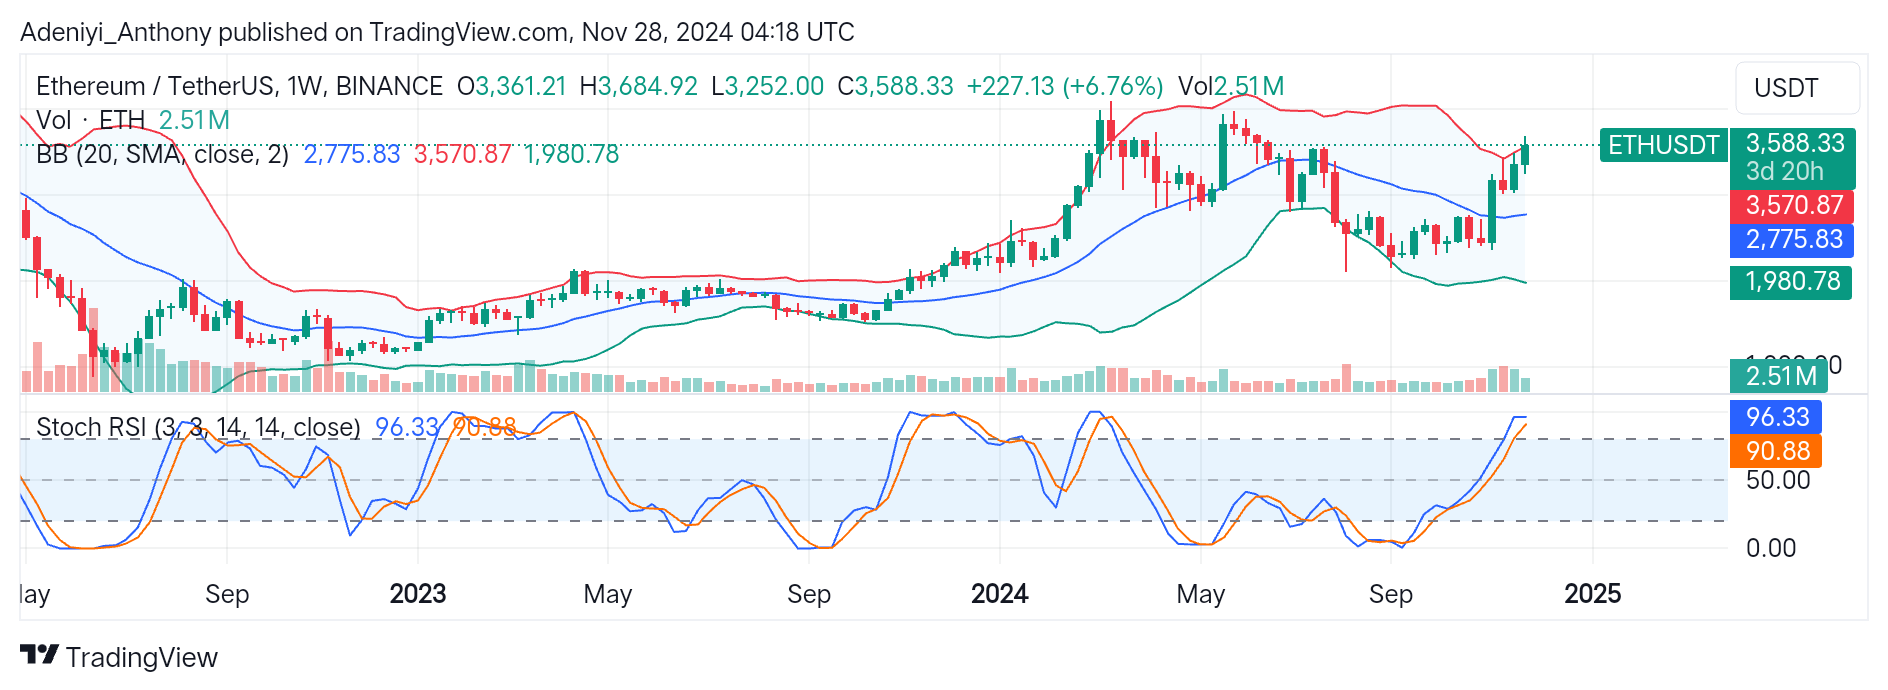
In contrast to Tether, Ethereum has recently shown remarkable positive momentum. With a robust weekly rise of 6.76%, ETH is close to a crucial mark at the upper Bollinger band section. As ETH/USDT gets closer to the upper Bollinger band, it just saw a notable bounce, rising above $3,570.87.
The market’s newfound optimism, supported by a moderate trading volume of 2.51 million, is reflected in the price movement. Traders must exercise cautionary optimism, though, as the signs point to an imminent pullback in the near future due to the rising volatility and overbought state.
Currently, ETH trades at $3,588.33, operating above the upper segment of the Bollinger bands.
Technical Indicators
Major Resistance Levels: $3,600, $3,800, and $4,000
Major Support Levels: $3,263, $2,930, and $2,775
Ethereum Technical Analysis
As Ethereum gets closer to a crucial resistance level at $3,600, the analysis of the pair indicates that it is on a positive trajectory. The widening Bollinger bands, however, suggest increasing volatility in the near future as the price moves closer to the upper. Furthermore, ETH/USDT is overextended in the short term and may need to retrace before continuing its upward trend, according to the Stochastic RSI readings of 96.33 and 90.88.
However, with a weekly moderate volume, a break above $3,600 with a sustained volume would indicate a bullish continuation. Conversely, a dip in price towards the $3,263 may indicate a move towards the mid-band at $2,775.83.
ETH/USDT Analysis: Expectation
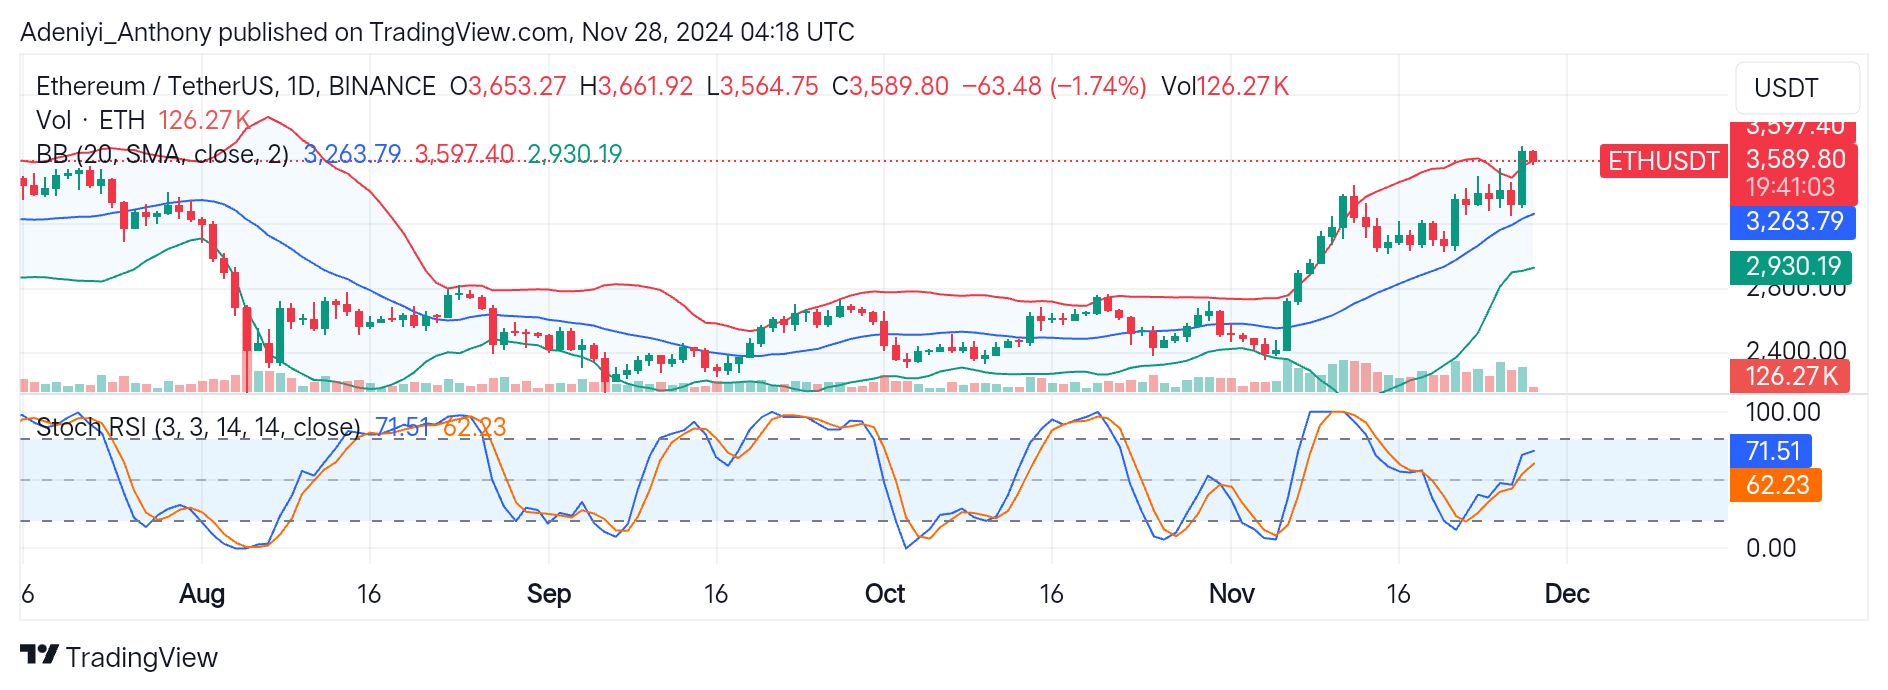
The analysis of ETH/USDT on a daily timeframe shows that the pair is slowing down as it approaches the $3,600 psychological level. As of right now, ETH is down 1.74% from the previous session, trading at $3,589. This suggests that the price is under some selling pressure close to its most recent high. The pair may stall or retrace a little before continuing to rise until it breaks close to the upper Bollinger band, which is about $3,600. However, despite the bearish candlestick’s formation, the Stochastic RSI readings of 71.51 and 62.23 indicate that the pair still has more space for improvement.
Therefore, if ETH fails to break above the $3,600 level, it could face a short-term correction towards the immediate support level at $3,263. Conversely, sustained buying pressure, especially with rising volume, is needed for Ethereum to break above the $3,600 level.
You can purchase crypto coins here. Buy LBlock