Ethereum Is in a Range as It Breaks the Resistance at $1,600
Estimated Reading Time: 2 minutes
Don’t invest unless you’re prepared to lose all the money you invest. This is a high-risk investment and you are unlikely to be protected if something goes wrong. Take 2 minutes to learn more
Ethereum Price Long-Term Analysis: Bullish
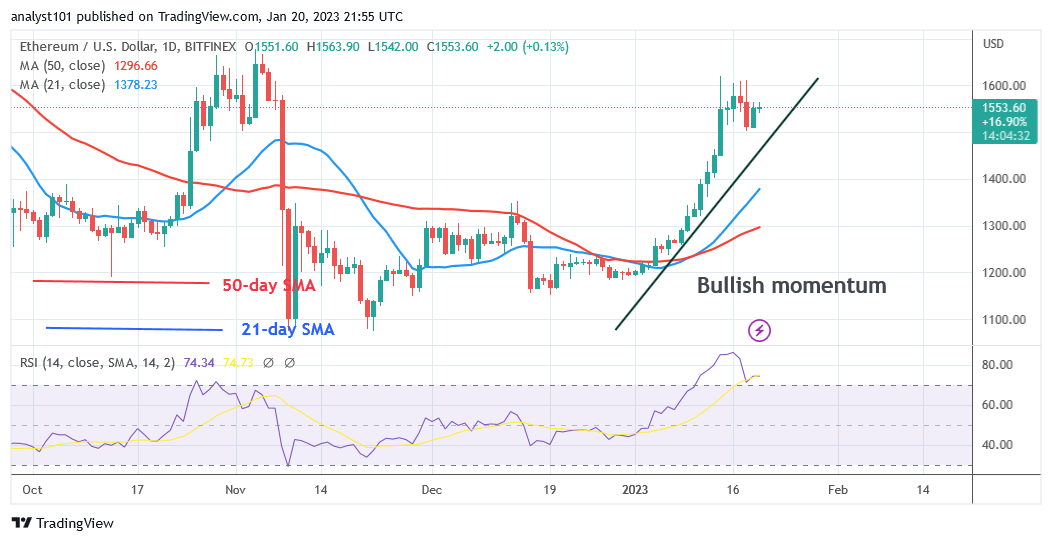
Ethereum (ETH) price has begun a new uptrend as it breaks the resistance at $1,600. Following the rejection at the $1,620 high, the largest altcoin has been moving in a sideways direction. Further price movement is unlikely because of the market’s extreme overbought condition. Ether’s price is currently rising as it tries to surpass the most recent high. The altcoin will still be repelled at the prior highs because the market is overbought, even if Ether’s price breaks through the initial resistance. In the event that sellers breach the $1,500 support, the downtrend will resume. At worst, ETH/USD will drop to $1,352. As long as these levels are kept, the altcoin will stay in a range. Ether is currently worth $1,591.50 and is increasing in value.
Ethereum Indicator Analysis
The largest altcoin is still trading at level 74 of the Relative Strength Index for period 14, which indicates an overbought condition. The bottom line is that if sellers show up in the overbought area, Ether will decline. Price bars that are above moving average lines show an increase in price. Below the daily Stochastic threshold of 50, the trend is negative.
Technical indicators:
Major Resistance Levels – $2, 600, $2,800, $3,000
Major Support Levels – $1.600, $1, 400, $1,200
What Is the Next Direction for Ethereum?
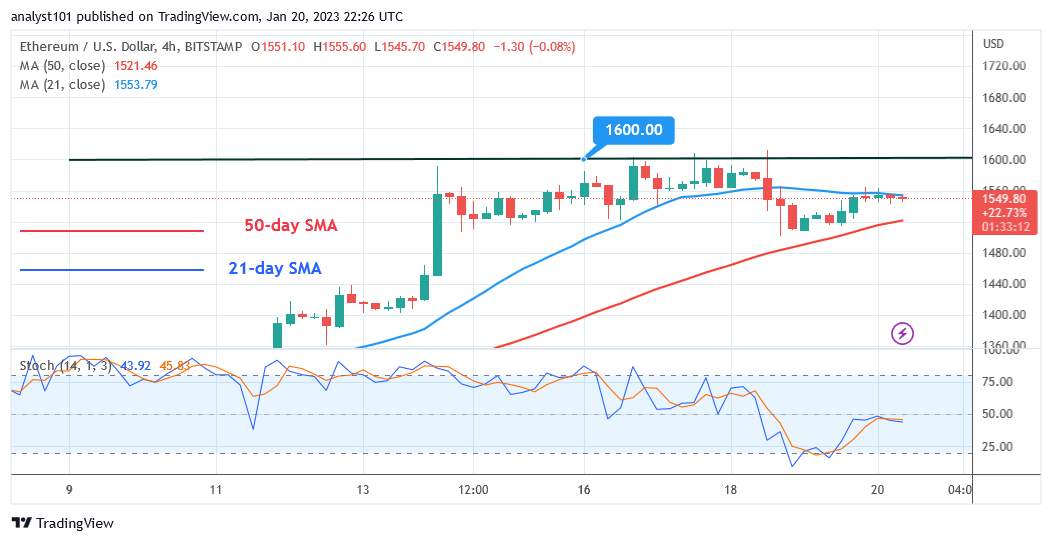
On the 4-hour chart, Ether is in a sideways trend as it breaks the resistance at $1,600. The altcoin has earlier fallen below the 21-day line SMA which led to its confinement. Today, it has broken above the 21-day line SMA. It is about to retest the resistance at $1,600. Ether will face rejection as it reaches the overbought region.
You can buy crypto coins here. Buy LBLOCK
Note: Cryptosignals.org is not a financial advisor. Do your research before investing your funds in any financial asset or presented product or event. We are not responsible for your investing results