Ethereum Trends Lower As It Approaches The $2,800 Support
Estimated Reading Time: 2 minutes
Don’t invest unless you’re prepared to lose all the money you invest. This is a high-risk investment and you are unlikely to be protected if something goes wrong. Take 2 minutes to learn more

Ethereum Price Long-Term Analysis: Bearish
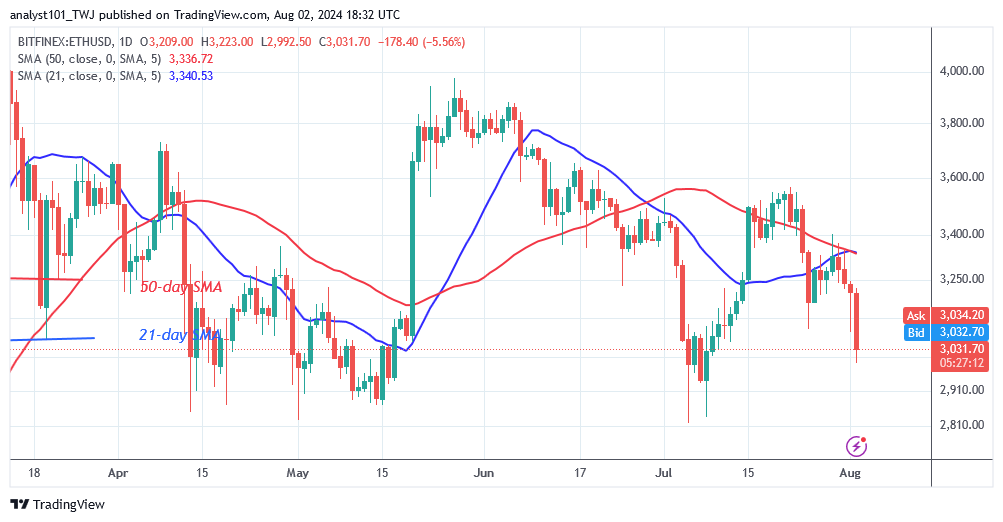
Ethereum’s (ETH) price has dropped to the psychological price threshold of $3,000 as it approaches the $2,800 support. The bears have outperformed the bulls, breaking below the moving average lines and the $3,000 price level. On July 25, the bulls halted the drop and bought on dips. The moving average lines halted the upward correction. On the downside, Ether is predicted to fall to lows of $2,850 and $2,800.
Nonetheless, since July 5, the previous low of $2,815 has held. Large candlestick tails also point to the present $2,800 support level. It shows heavy buying pressure near the $2,800 support level. The altcoin has plunged to a low of $2,983 as of this writing.
Technical indicators:
Major Resistance Levels – $3, 600, $3,800, $4,000
Major Support Levels – $2.600, $2, 400, $2,200
Ethereum Indicator Analysis
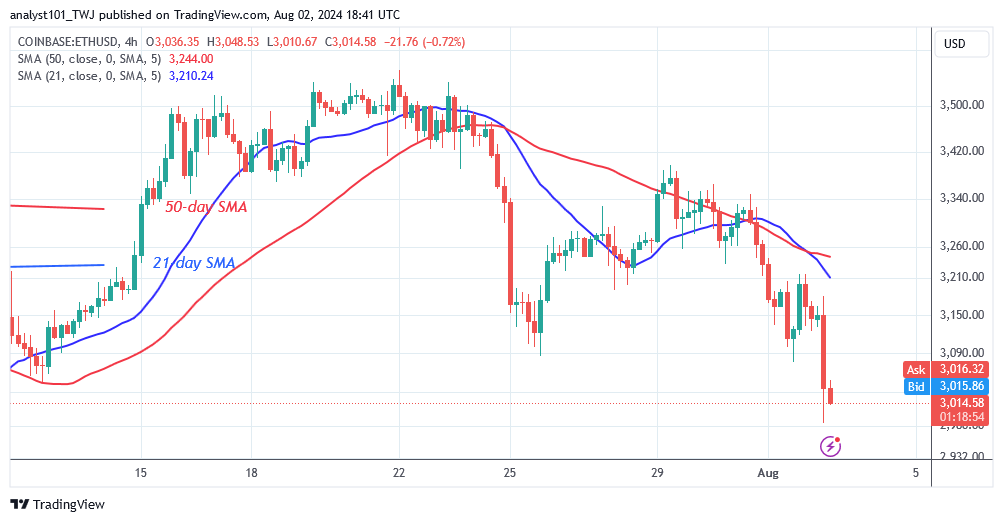
Ether price bars have dropped drastically below the moving average lines. The 4-hour chart shows a bearish crossover between Ether’s moving average lines when the 21-day SMA breaks below it. The price action is signaling a gloomy trend for the coin.
Conclusion
Ethereum is dropping below the moving average lines as it approaches the $2,800 support. The altcoin is approaching its prior low on April 13. Every time the cryptocurrency reaches the bottom of the chart, its price reverses. In other words, Ether will reverse at the $2,800 support level. Meanwhile, the crypto signal is bearish as Ether’s price falls further.
You can purchase Lucky Block here. Buy LBLOCK
Note: Cryptosignals.org is not a financial advisor. Do your research before investing your funds in any financial asset or presented product or event. We are not responsible for your investing results.